move the mouse pointer over that image.
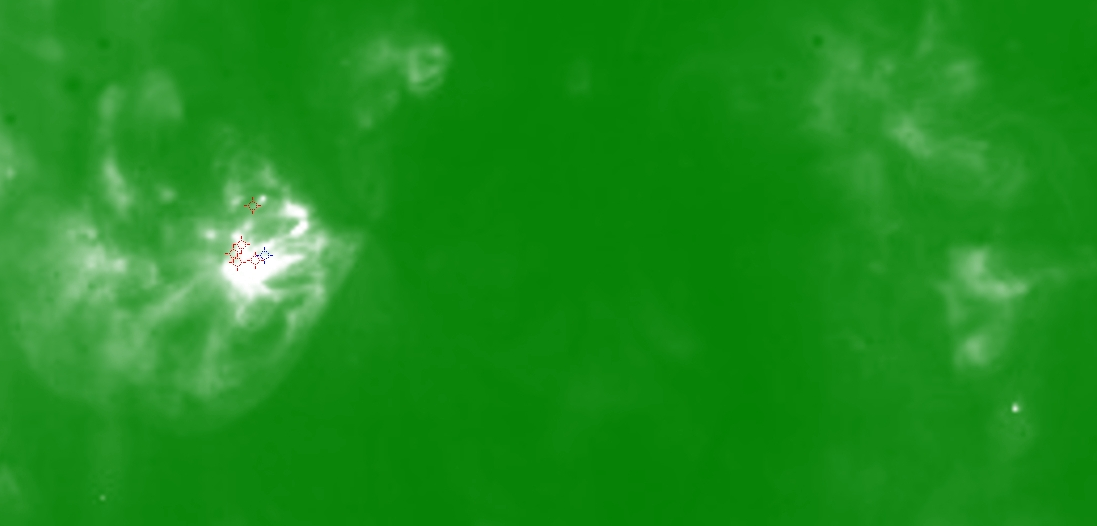
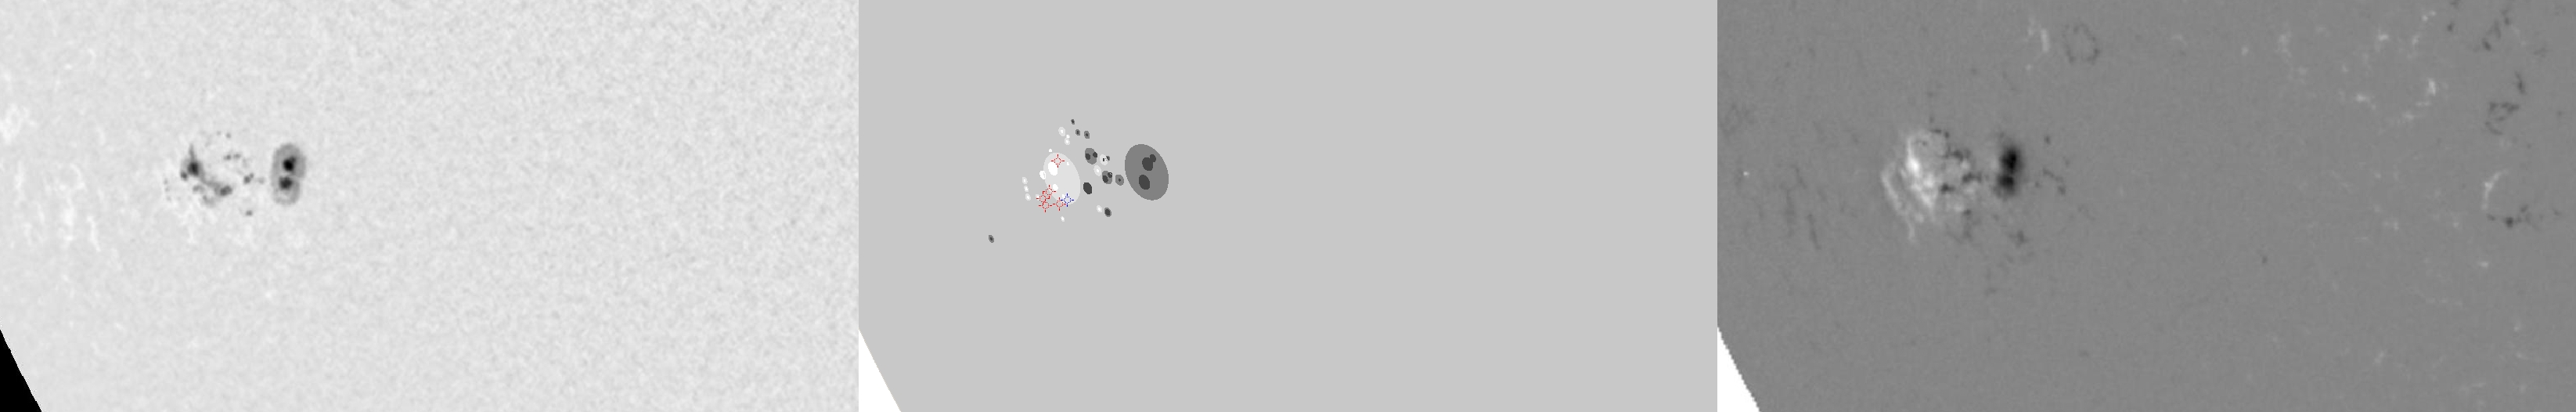
| Evolution of sunspot group NOAA 10656 and positions of flares in it animated by using the data of SOHO/MDI Debrecen Data (SDD) sunspot catalogue (lower panel, middle, ellipses with positions and areas corresponding to the relevant data of spots in SDD and with grey-scale colour coding of the magnetic polarities corresponding to that of the magnetograms), SOHO/MDI continuum images (lower panel, left) and magnetograms (lower panel, right), SOHO/EIT images (upper panel, middle), GOES and RHESSI flare data (red and blue symbols) observed within the interval around the time of SDD data. |
|
When you want to zoom in on one of the images, simply move the mouse pointer over that image. |
 |
| Year | Month | Day | Hour | Min | Sec | NOAA | Proj.U | Proj.WS | Corr.U | Corr.WS | B | L | LCM | Pos.angle | r | MU | MP |
|---|---|---|---|---|---|---|---|---|---|---|---|---|---|---|---|---|---|
| 2004 | 08 | 08 | 17 | 35 | 32 | 10656 | 119 | 856 | 90 | 656 | -12.45 | 83.72 | -46.20 | 112.32 | 0.7628 | -389.9 | -21.4 |
| Flare | Date | Start | Peak | End | Dur [s] | Peak [c/s] | Total Counts | Energy [keV] | X pos [asec] | Y pos [asec] | Radial [asec] | B [deg] | L [deg] | Flags |
|---|---|---|---|---|---|---|---|---|---|---|---|---|---|---|
| 4080803 | 8-Aug-2004 | 16:44:00 | 16:49:30 | 16:53:08 | 548 | 240 | 441552 | 12-25 | -711 | -301 | 772 | -14.25 | 79.96 | A0 DF P1 |
| 4080804 | 8-Aug-2004 | 17:28:08 | 17:28:58 | 17:53:08 | 1500 | 912 | 1714704 | 12-25 | -717 | -298 | 777 | -14.11 | 79.07 | A0 DF DR ES P1 |
| 4080887 | 8-Aug-2004 | 17:53:08 | 17:54:30 | 17:58:16 | 308 | 52 | 69936 | 6-12 | -707 | -293 | 766 | -13.70 | 79.91 | A0 DF DR P1 PE |
| 4080811 | 8-Aug-2004 | 17:58:16 | 17:59:34 | 18:04:48 | 392 | 36 | 56736 | 6-12 | -709 | -304 | 772 | -14.43 | 79.46 | A0 DF DR P1 PE |
| 4080866 | 8-Aug-2004 | 18:13:32 | 18:14:02 | 18:15:48 | 136 | 32 | 18576 | 6-12 | -696 | -269 | 746 | -12.08 | 81.17 | A0 DF DR P1 |
| Date | Start | Peak | End | Classification | B [deg] | LCM [deg] |
|---|---|---|---|---|---|---|
| 8-Aug-2004 | 16:59 | 17:24 | 17:36 | C2.7 | -14 | -49 |

