move the mouse pointer over that image.
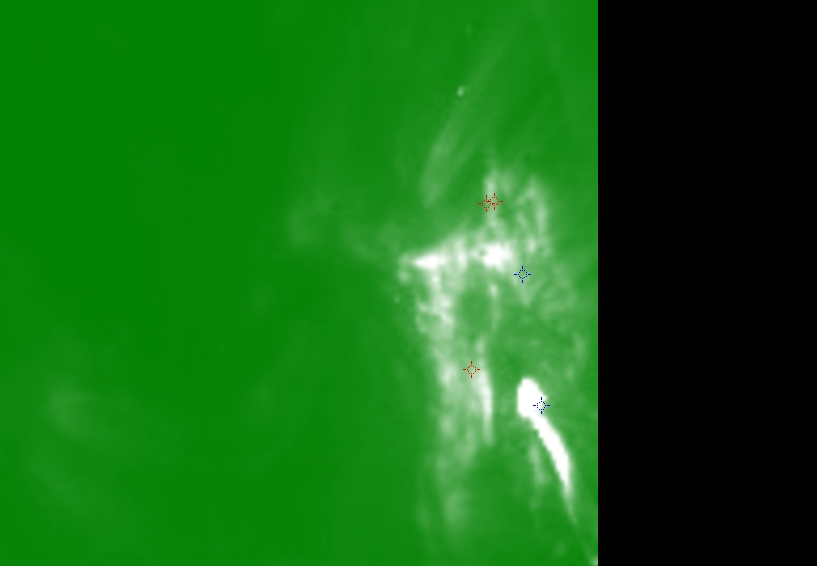
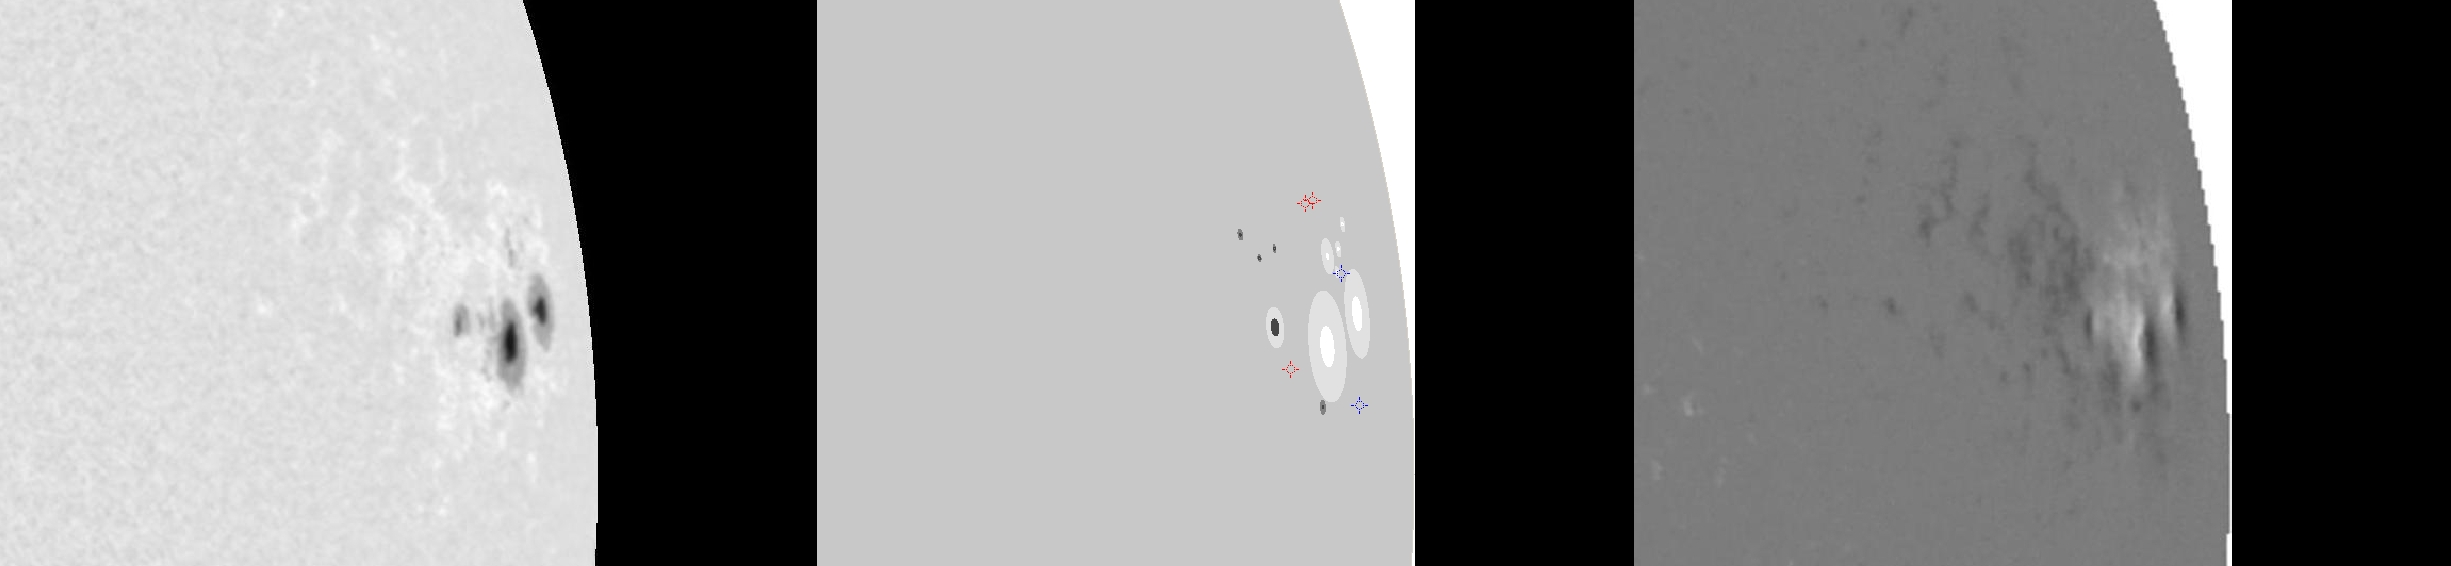
| Evolution of sunspot group NOAA 10652 and positions of flares in it animated by using the data of SOHO/MDI Debrecen Data (SDD) sunspot catalogue (lower panel, middle, ellipses with positions and areas corresponding to the relevant data of spots in SDD and with grey-scale colour coding of the magnetic polarities corresponding to that of the magnetograms), SOHO/MDI continuum images (lower panel, left) and magnetograms (lower panel, right), SOHO/EIT images (upper panel, middle), GOES and RHESSI flare data (red and blue symbols) observed within the interval around the time of SDD data. |
|
When you want to zoom in on one of the images, simply move the mouse pointer over that image. |
 |
| Year | Month | Day | Hour | Min | Sec | NOAA | Proj.U | Proj.WS | Corr.U | Corr.WS | B | L | LCM | Pos.angle | r | MU | MP |
|---|---|---|---|---|---|---|---|---|---|---|---|---|---|---|---|---|---|
| 2004 | 07 | 28 | 15 | 59 | 32 | 10652 | 99 | 790 | 161 | 1280 | 7.30 | 348.99 | 72.69 | 275.91 | 0.9523 | 169.9 | 130.9 |
| Flare | Date | Start | Peak | End | Dur [s] | Peak [c/s] | Total Counts | Energy [keV] | X pos [asec] | Y pos [asec] | Radial [asec] | B [deg] | L [deg] | Flags |
|---|---|---|---|---|---|---|---|---|---|---|---|---|---|---|
| 4072814 | 28-Jul-2004 | 16:08:00 | 16:13:14 | 16:13:24 | 324 | 16 | 10544 | 6-12 | 893 | 170 | 910 | 11.95 | 347.37 | a0 A1 DF GE P1 PE |
| 4072809 | 28-Jul-2004 | 16:18:48 | 16:19:26 | 16:21:44 | 176 | 10 | 7873 | 6-12 | 898 | 172 | 914 | 11.97 | 348.35 | A1 DF GS P1 PE |
| 4072866 | 28-Jul-2004 | 16:21:44 | 16:27:18 | 16:39:08 | 1044 | 28 | 45998 | 12-25 | 887 | 67 | 889 | 6.05 | 343.56 | a0 A1 DF DR P1 |
| Date | Start | Peak | End | Classification | B [deg] | LCM [deg] |
|---|---|---|---|---|---|---|
| 28-Jul-2004 | 15:28 | 15:34 | 15:36 | C3.6 | 04 | 74 |
| 28-Jul-2004 | 16:08 | 16:27 | 16:33 | C3.3 | 09 | 74 |

