move the mouse pointer over that image.
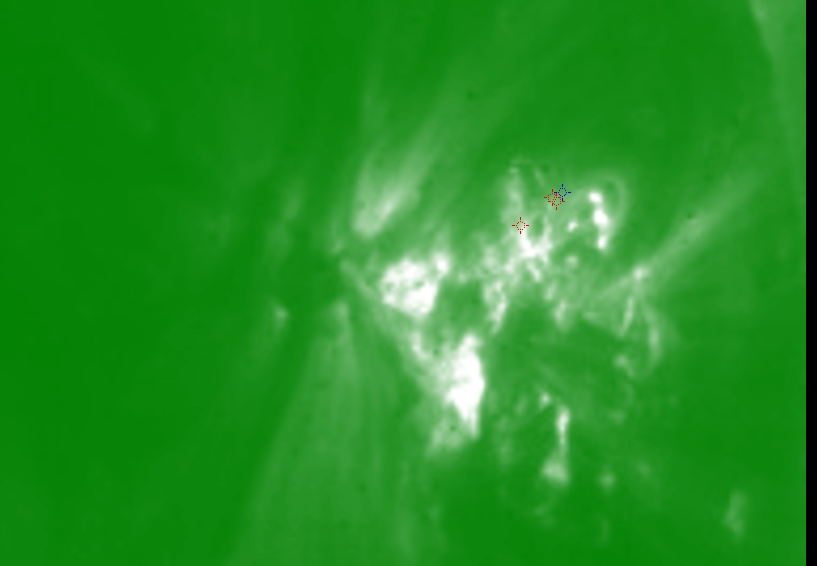
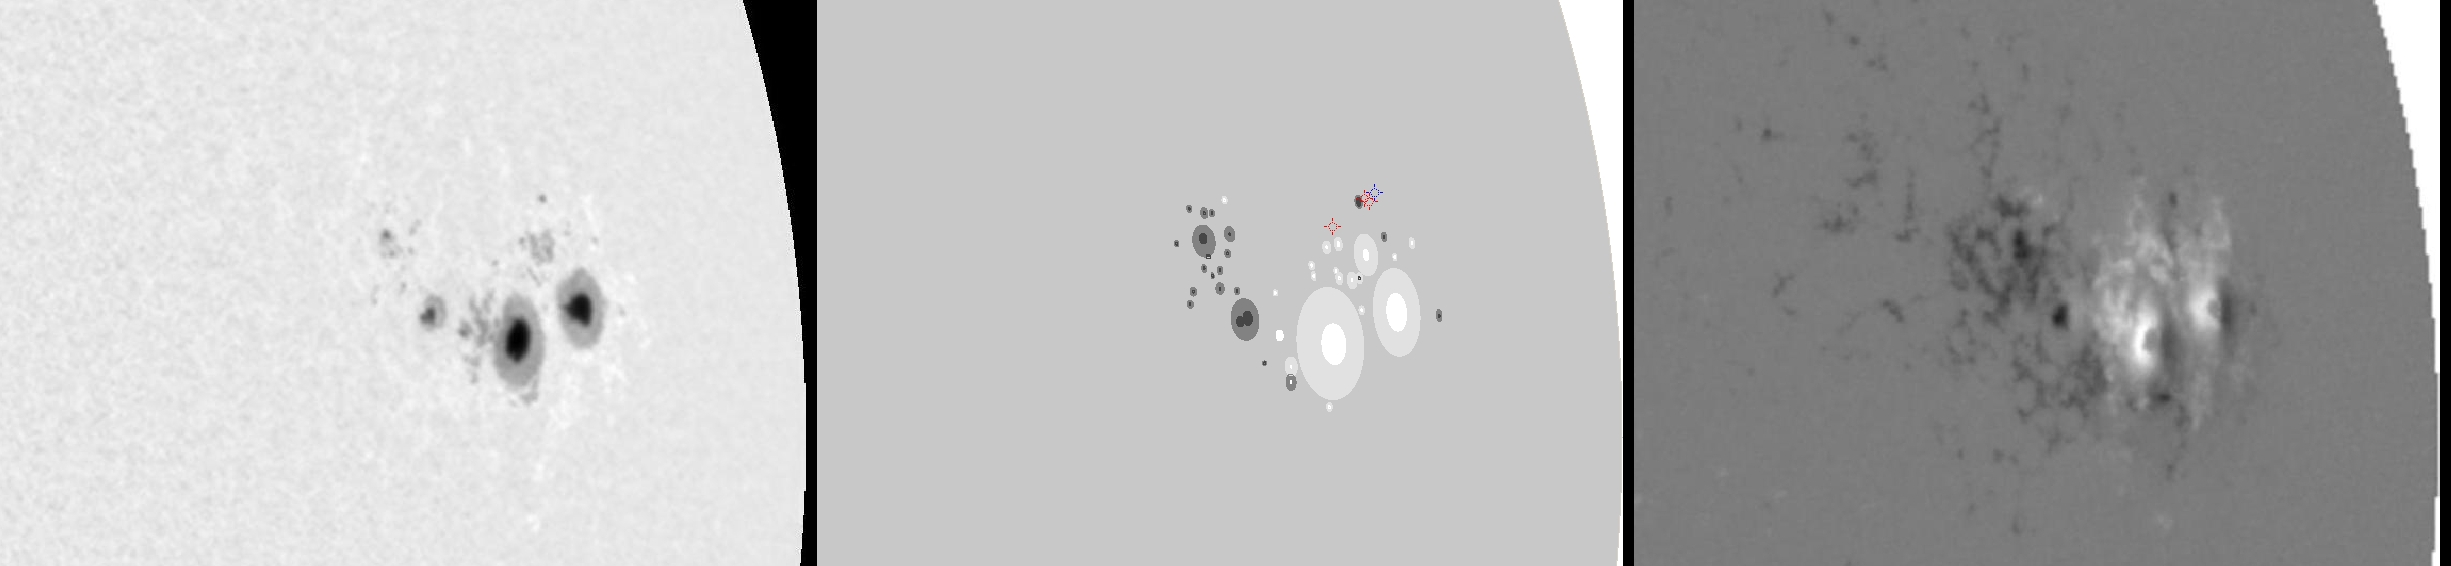
| Evolution of sunspot group NOAA 10652 and positions of flares in it animated by using the data of SOHO/MDI Debrecen Data (SDD) sunspot catalogue (lower panel, middle, ellipses with positions and areas corresponding to the relevant data of spots in SDD and with grey-scale colour coding of the magnetic polarities corresponding to that of the magnetograms), SOHO/MDI continuum images (lower panel, left) and magnetograms (lower panel, right), SOHO/EIT images (upper panel, middle), GOES and RHESSI flare data (red and blue symbols) observed within the interval around the time of SDD data. |
|
When you want to zoom in on one of the images, simply move the mouse pointer over that image. |
 |
| Year | Month | Day | Hour | Min | Sec | NOAA | Proj.U | Proj.WS | Corr.U | Corr.WS | B | L | LCM | Pos.angle | r | MU | MP |
|---|---|---|---|---|---|---|---|---|---|---|---|---|---|---|---|---|---|
| 2004 | 07 | 27 | 09 | 35 | 32 | 10652 | 231 | 1751 | 203 | 1508 | 7.72 | 348.24 | 55.18 | 275.66 | 0.8184 | 485.7 | 234.0 |
| Flare | Date | Start | Peak | End | Dur [s] | Peak [c/s] | Total Counts | Energy [keV] | X pos [asec] | Y pos [asec] | Radial [asec] | B [deg] | L [deg] | Flags |
|---|---|---|---|---|---|---|---|---|---|---|---|---|---|---|
| 4072775 | 27-Jul-2004 | 09:51:20 | 09:52:46 | 09:54:36 | 196 | 7 | 7483 | 12-25 | 805 | 151 | 820 | 11.85 | 351.04 | A0 DF GS P1 PE |
| 4072794 | 27-Jul-2004 | 09:54:36 | 10:00:42 | 10:12:44 | 1088 | 17 | 60549 | 12-25 | 809 | 149 | 823 | 11.70 | 351.39 | A0 DF P1 PE |
| 4072707 | 27-Jul-2004 | 10:14:28 | 10:17:34 | 10:29:12 | 884 | 30 | 58152 | 12-25 | 790 | 134 | 801 | 10.98 | 348.81 | a0 A1 DF P1 |
| Date | Start | Peak | End | Classification | B [deg] | LCM [deg] |
|---|---|---|---|---|---|---|
| 27-Jul-2004 | 09:14 | 10:18 | 11:05 | C3.7 | 12 | 59 |

