move the mouse pointer over that image.
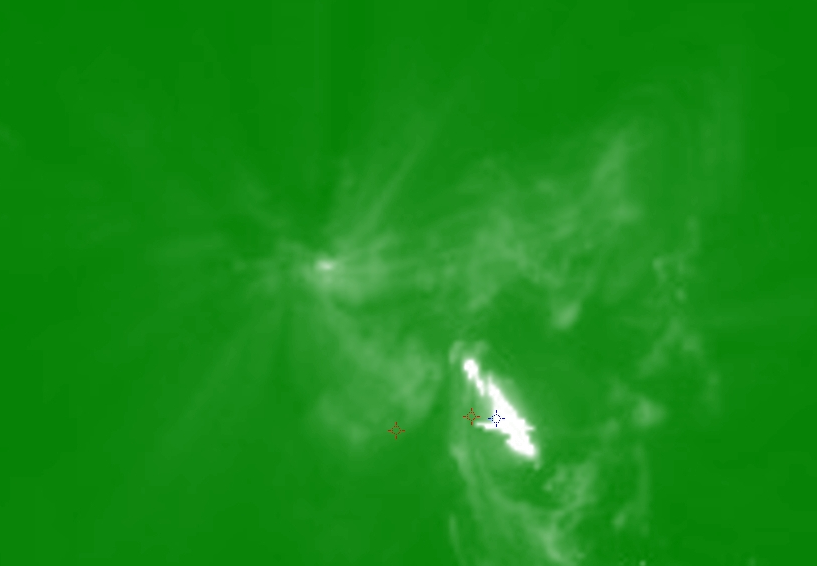
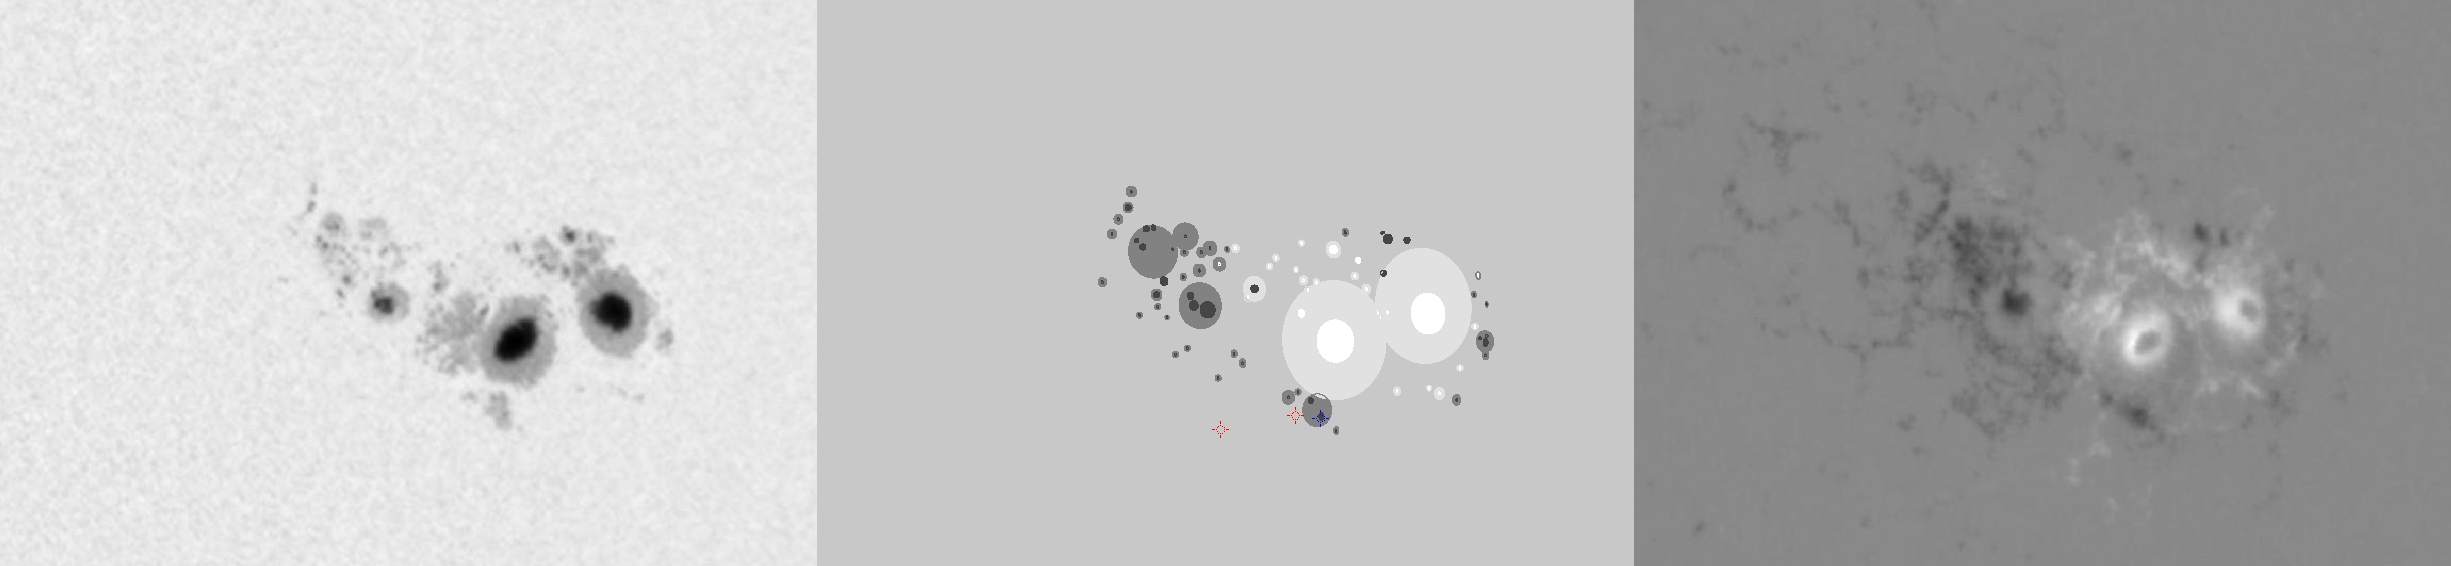
| Evolution of sunspot group NOAA 10652 and positions of flares in it animated by using the data of SOHO/MDI Debrecen Data (SDD) sunspot catalogue (lower panel, middle, ellipses with positions and areas corresponding to the relevant data of spots in SDD and with grey-scale colour coding of the magnetic polarities corresponding to that of the magnetograms), SOHO/MDI continuum images (lower panel, left) and magnetograms (lower panel, right), SOHO/EIT images (upper panel, middle), GOES and RHESSI flare data (red and blue symbols) observed within the interval around the time of SDD data. |
|
When you want to zoom in on one of the images, simply move the mouse pointer over that image. |
 |
| Year | Month | Day | Hour | Min | Sec | NOAA | Proj.U | Proj.WS | Corr.U | Corr.WS | B | L | LCM | Pos.angle | r | MU | MP |
|---|---|---|---|---|---|---|---|---|---|---|---|---|---|---|---|---|---|
| 2004 | 07 | 25 | 14 | 23 | 32 | 10652 | 429 | 3583 | 249 | 2080 | 7.87 | 348.16 | 31.29 | 276.71 | 0.5195 | 713.0 | 268.0 |
| Flare | Date | Start | Peak | End | Dur [s] | Peak [c/s] | Total Counts | Energy [keV] | X pos [asec] | Y pos [asec] | Radial [asec] | B [deg] | L [deg] | Flags |
|---|---|---|---|---|---|---|---|---|---|---|---|---|---|---|
| 4072516 | 25-Jul-2004 | 13:34:16 | 13:41:38 | 13:42:24 | 488 | 192 | 144511 | 12-25 | 468 | -7 | 469 | 4.15 | 345.73 | a0 A1 DF EE P1 |
| 4072556 | 25-Jul-2004 | 14:16:36 | 14:28:26 | 14:28:36 | 720 | 240 | 406268 | 6-12 | 434 | -15 | 434 | 3.77 | 342.99 | A0 DF GE P1 PE |
| 4072596 | 25-Jul-2004 | 14:52:20 | 14:58:34 | 15:05:04 | 764 | 168 | 646080 | 6-12 | 528 | -140 | 546 | -4.00 | 349.21 | A1 |
| 4072575 | 25-Jul-2004 | 15:05:04 | 15:07:50 | 15:18:04 | 780 | 160 | 589521 | 6-12 | 506 | -114 | 519 | -2.36 | 347.51 | a0 A1 DF P1 |
| Date | Start | Peak | End | Classification | B [deg] | LCM [deg] |
|---|---|---|---|---|---|---|
| 25-Jul-2004 | 13:37 | 13:49 | 13:55 | M2.2 | 04 | 30 |

