move the mouse pointer over that image.
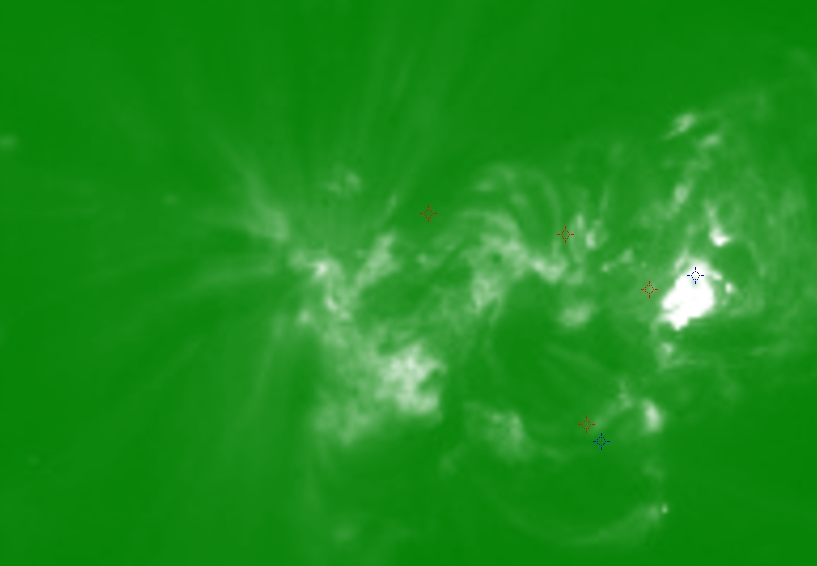
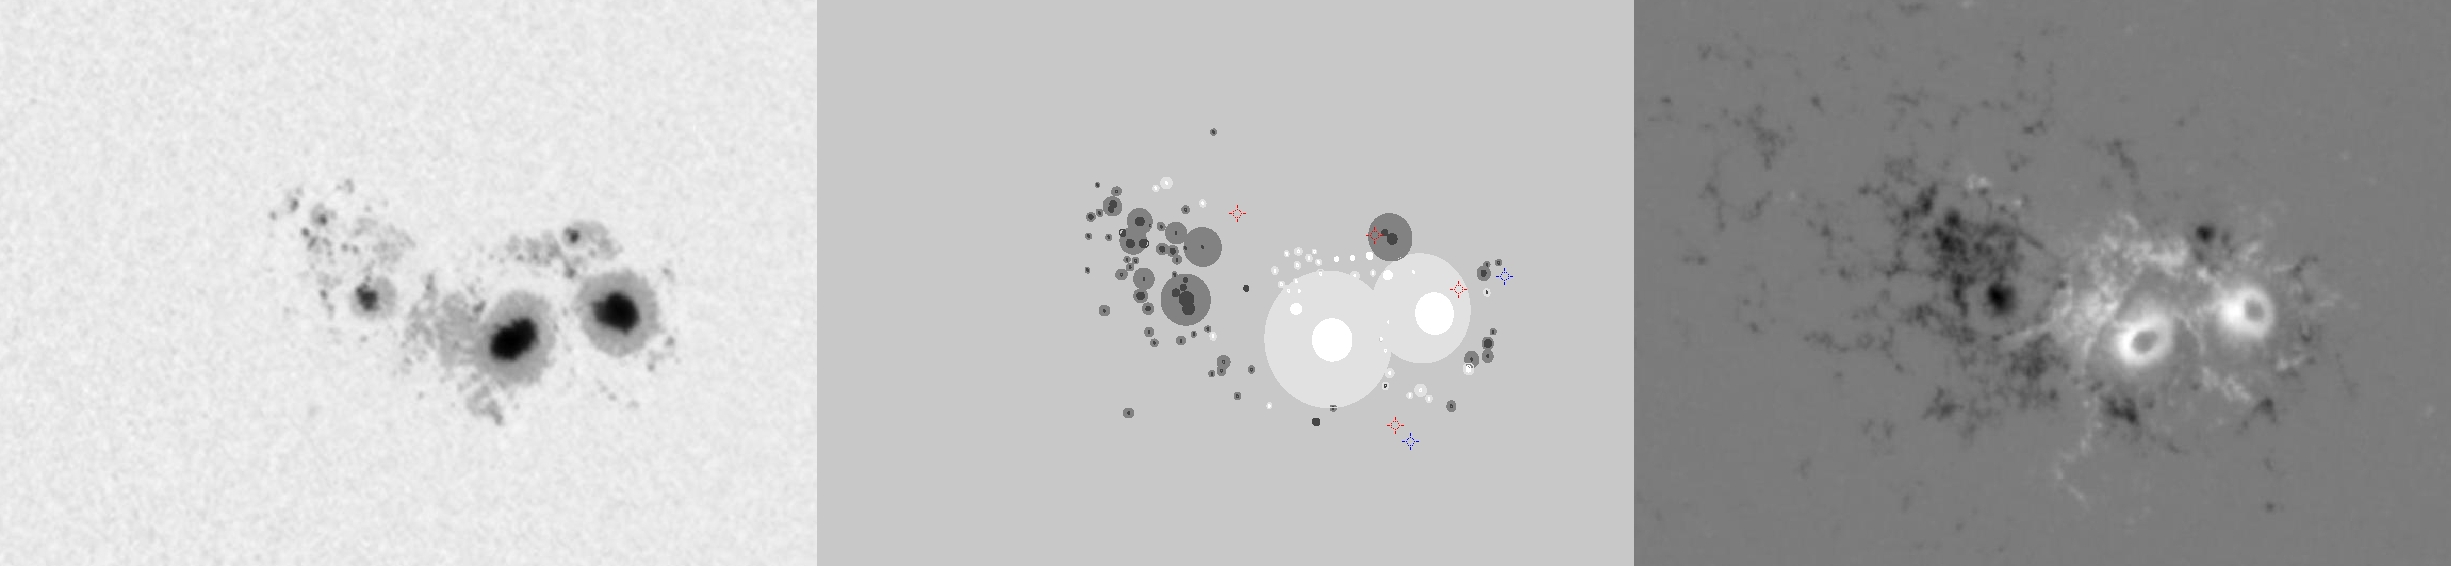
| Evolution of sunspot group NOAA 10652 and positions of flares in it animated by using the data of SOHO/MDI Debrecen Data (SDD) sunspot catalogue (lower panel, middle, ellipses with positions and areas corresponding to the relevant data of spots in SDD and with grey-scale colour coding of the magnetic polarities corresponding to that of the magnetograms), SOHO/MDI continuum images (lower panel, left) and magnetograms (lower panel, right), SOHO/EIT images (upper panel, middle), GOES and RHESSI flare data (red and blue symbols) observed within the interval around the time of SDD data. |
|
When you want to zoom in on one of the images, simply move the mouse pointer over that image. |
 |
| Year | Month | Day | Hour | Min | Sec | NOAA | Proj.U | Proj.WS | Corr.U | Corr.WS | B | L | LCM | Pos.angle | r | MU | MP |
|---|---|---|---|---|---|---|---|---|---|---|---|---|---|---|---|---|---|
| 2004 | 07 | 24 | 23 | 59 | 32 | 10652 | 510 | 4420 | 277 | 2390 | 8.06 | 347.97 | 23.16 | 278.73 | 0.3958 | 631.0 | 215.5 |
| Flare | Date | Start | Peak | End | Dur [s] | Peak [c/s] | Total Counts | Energy [keV] | X pos [asec] | Y pos [asec] | Radial [asec] | B [deg] | L [deg] | Flags |
|---|---|---|---|---|---|---|---|---|---|---|---|---|---|---|
| 4072499 | 24-Jul-2004 | 23:10:20 | 23:17:10 | 23:18:36 | 496 | 1008 | 1057752 | 25-50 | 416 | -17 | 416 | 3.65 | 350.16 | A0 DF DR EE P1 |
| 4072440 | 24-Jul-2004 | 23:51:56 | 23:55:10 | 23:56:36 | 280 | 3 | 4125 | 6-12 | 328 | 116 | 348 | 11.77 | 344.51 | A0 DF DR P1 PE |
| 4072545 | 25-Jul-2004 | 00:22:40 | 00:23:26 | 00:25:16 | 156 | 4 | 1984 | 6-12 | 421 | 103 | 434 | 10.78 | 350.32 | A0 DF P1 |
| 4072586 | 25-Jul-2004 | 00:25:16 | 00:31:06 | 00:54:36 | 1760 | 496 | 1163042 | 12-25 | 475 | 69 | 480 | 8.60 | 353.76 | a0 A1 DF DR EE P1 PE |
| Date | Start | Peak | End | Classification | B [deg] | LCM [deg] |
|---|---|---|---|---|---|---|
| 24-Jul-2004 | 23:11 | 23:22 | 23:32 | C2.7 | 03 | 26 |
| 25-Jul-2004 | 00:25 | 00:32 | 00:36 | C7.4 | 09 | 31 |

