move the mouse pointer over that image.
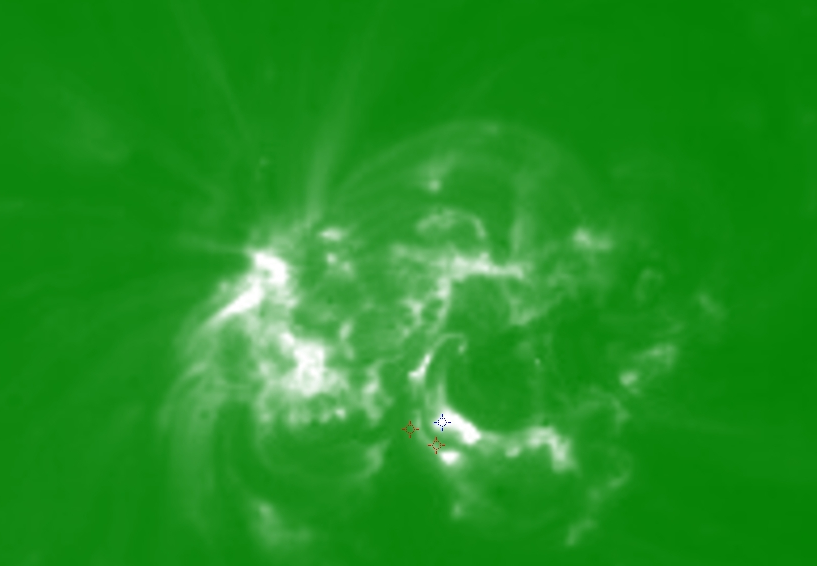
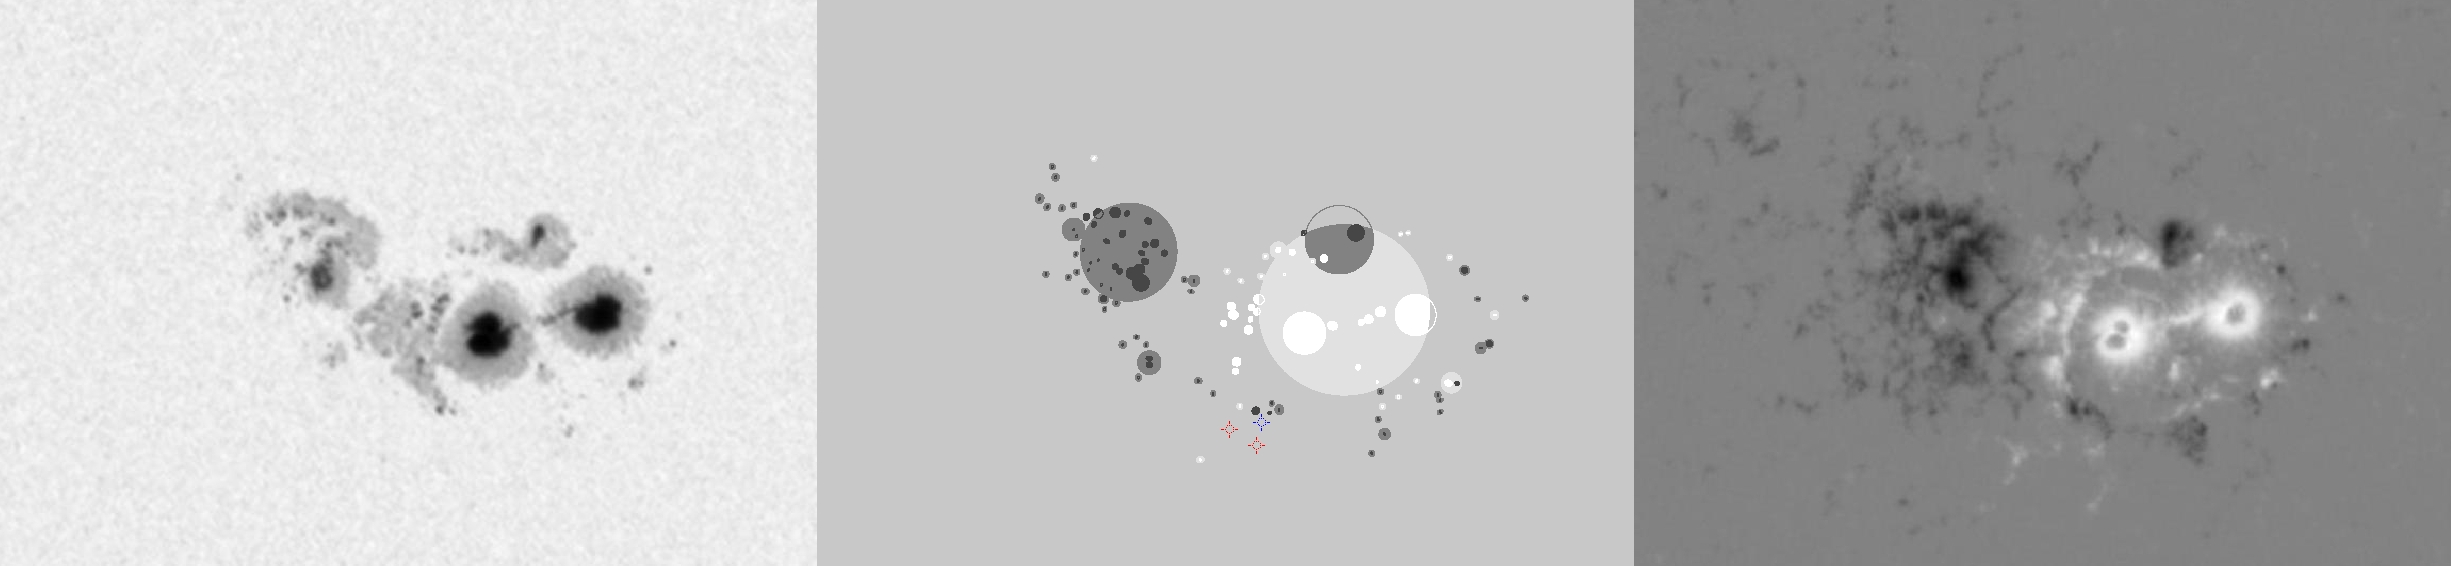
| Evolution of sunspot group NOAA 10652 and positions of flares in it animated by using the data of SOHO/MDI Debrecen Data (SDD) sunspot catalogue (lower panel, middle, ellipses with positions and areas corresponding to the relevant data of spots in SDD and with grey-scale colour coding of the magnetic polarities corresponding to that of the magnetograms), SOHO/MDI continuum images (lower panel, left) and magnetograms (lower panel, right), SOHO/EIT images (upper panel, middle), GOES and RHESSI flare data (red and blue symbols) observed within the interval around the time of SDD data. |
|
When you want to zoom in on one of the images, simply move the mouse pointer over that image. |
 |
| Year | Month | Day | Hour | Min | Sec | NOAA | Proj.U | Proj.WS | Corr.U | Corr.WS | B | L | LCM | Pos.angle | r | MU | MP |
|---|---|---|---|---|---|---|---|---|---|---|---|---|---|---|---|---|---|
| 2004 | 07 | 22 | 17 | 35 | 32 | 10652 | 681 | 5167 | 339 | 2591 | 8.52 | 347.78 | -7.03 | 63.39 | 0.1359 | 723.3 | 135.7 |
| Flare | Date | Start | Peak | End | Dur [s] | Peak [c/s] | Total Counts | Energy [keV] | X pos [asec] | Y pos [asec] | Radial [asec] | B [deg] | L [deg] | Flags |
|---|---|---|---|---|---|---|---|---|---|---|---|---|---|---|
| 4072229 | 22-Jul-2004 | 17:26:28 | 17:26:46 | 17:29:04 | 156 | 60 | 46644 | 6-12 | -143 | -20 | 144 | 3.73 | 345.63 | A0 a1 DF DR P1 |
| 40722104 | 22-Jul-2004 | 17:29:04 | 17:31:10 | 17:51:24 | 1340 | 2032 | 4928880 | 6-12 | -125 | -30 | 129 | 3.15 | 346.68 | A0 a1 DF DR GE P1 PE |
| Date | Start | Peak | End | Classification | B [deg] | LCM [deg] |
|---|---|---|---|---|---|---|
| 22-Jul-2004 | 17:17 | 17:24 | 17:37 | C3.2 | 04 | -08 |

