move the mouse pointer over that image.
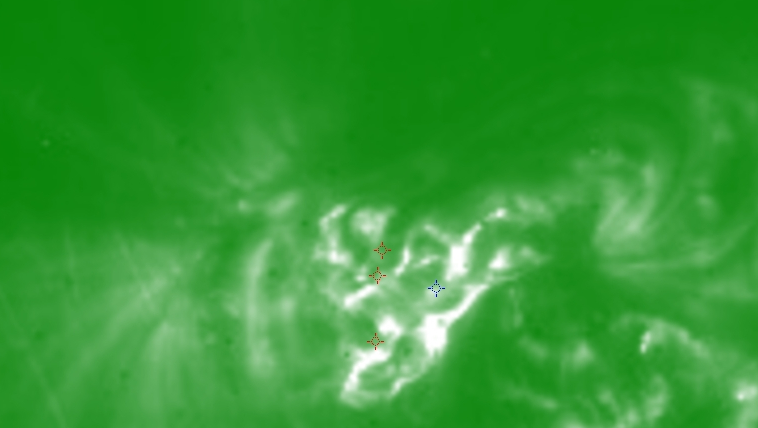
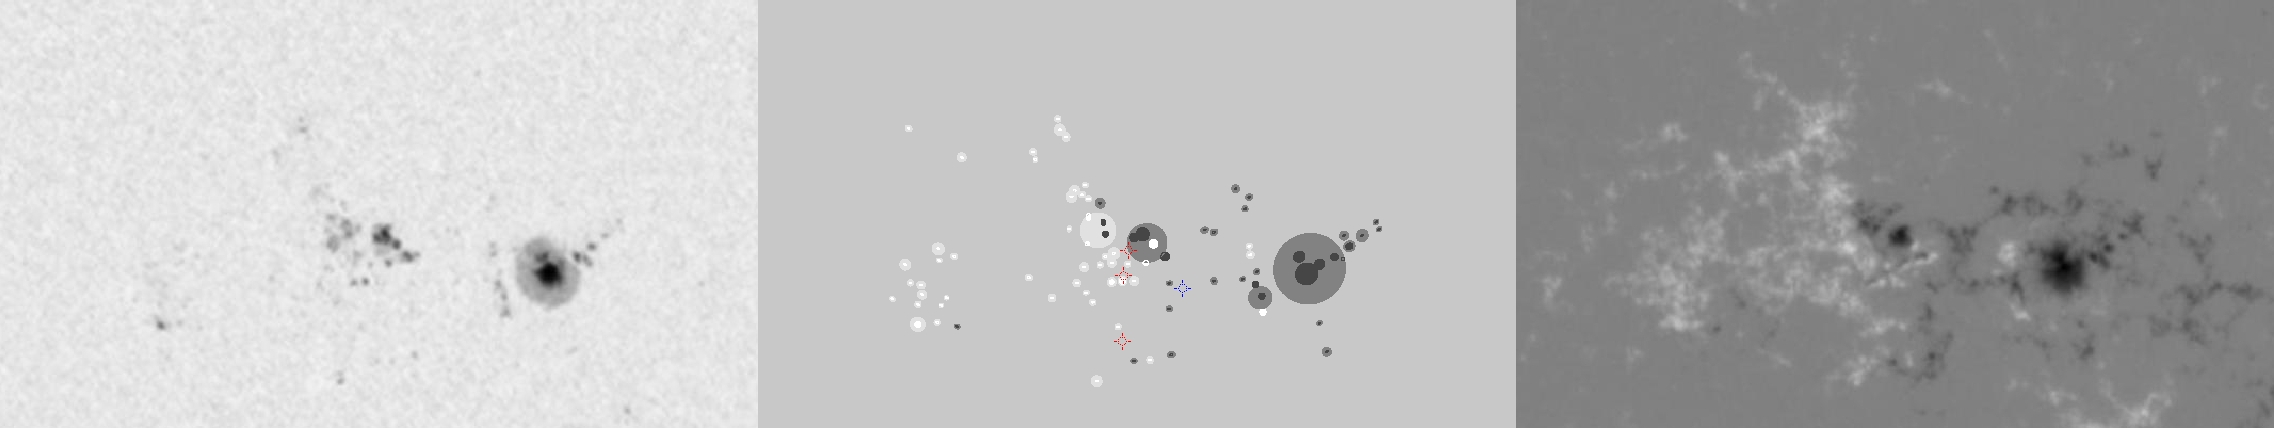
| Evolution of sunspot group NOAA 10649 and positions of flares in it animated by using the data of SOHO/MDI Debrecen Data (SDD) sunspot catalogue (lower panel, middle, ellipses with positions and areas corresponding to the relevant data of spots in SDD and with grey-scale colour coding of the magnetic polarities corresponding to that of the magnetograms), SOHO/MDI continuum images (lower panel, left) and magnetograms (lower panel, right), SOHO/EIT images (upper panel, middle), GOES and RHESSI flare data (red and blue symbols) observed within the interval around the time of SDD data. |
|
When you want to zoom in on one of the images, simply move the mouse pointer over that image. |
 |
| Year | Month | Day | Hour | Min | Sec | NOAA | Proj.U | Proj.WS | Corr.U | Corr.WS | B | L | LCM | Pos.angle | r | MU | MP |
|---|---|---|---|---|---|---|---|---|---|---|---|---|---|---|---|---|---|
| 2004 | 07 | 19 | 04 | 47 | 32 | 10649 | 166 | 1299 | 85 | 674 | -9.80 | 45.79 | 4.22 | 194.78 | 0.2739 | -950.7 | -205.2 |
| Flare | Date | Start | Peak | End | Dur [s] | Peak [c/s] | Total Counts | Energy [keV] | X pos [asec] | Y pos [asec] | Radial [asec] | B [deg] | L [deg] | Flags |
|---|---|---|---|---|---|---|---|---|---|---|---|---|---|---|
| 4071960 | 19-Jul-2004 | 04:32:52 | 04:44:06 | 04:48:08 | 916 | 13 | 35457 | 12-25 | 32 | -293 | 295 | -13.05 | 42.84 | A0 DR P1 Q2 |
| 40719121 | 19-Jul-2004 | 04:48:08 | 04:49:54 | 04:53:08 | 300 | 12 | 11694 | 12-25 | 38 | -236 | 239 | -9.52 | 43.12 | A0 DR P1 |
| 40719122 | 19-Jul-2004 | 04:53:08 | 05:16:54 | 05:21:56 | 1728 | 38 | 166564 | 12-25 | 43 | -252 | 256 | -10.51 | 43.19 | A0 DF DR P1 PE |
| Date | Start | Peak | End | Classification | B [deg] | LCM [deg] |
|---|---|---|---|---|---|---|
| 19-Jul-2004 | 05:24 | 05:33 | 05:42 | C4.6 | -11 | 04 |

