move the mouse pointer over that image.
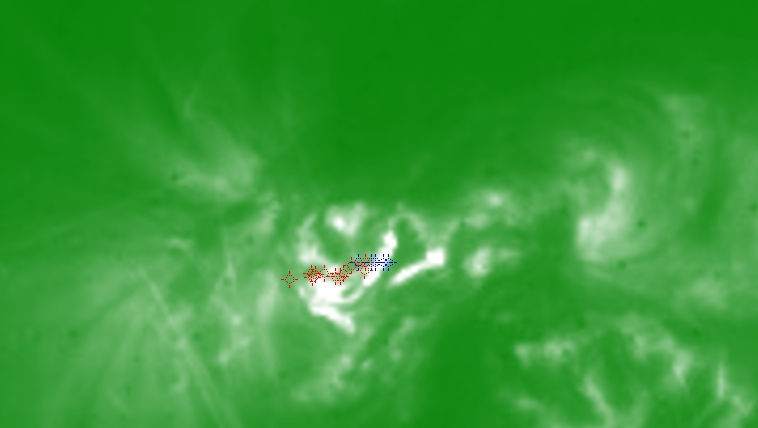
| Evolution of sunspot group NOAA 10649 and positions of flares in it animated by using the data of SOHO/MDI Debrecen Data (SDD) sunspot catalogue (lower panel, middle, ellipses with positions and areas corresponding to the relevant data of spots in SDD and with grey-scale colour coding of the magnetic polarities corresponding to that of the magnetograms), SOHO/MDI continuum images (lower panel, left) and magnetograms (lower panel, right), SOHO/EIT images (upper panel, middle), GOES and RHESSI flare data (red and blue symbols) observed within the interval around the time of SDD data. |
|
When you want to zoom in on one of the images, simply move the mouse pointer over that image. |
 |
| Year | Month | Day | Hour | Min | Sec | NOAA | Proj.U | Proj.WS | Corr.U | Corr.WS | B | L | LCM | Pos.angle | r | MU | MP |
|---|---|---|---|---|---|---|---|---|---|---|---|---|---|---|---|---|---|
| 2004 | 07 | 18 | 17 | 35 | 32 | 10649 | 193 | 1393 | 99 | 716 | -9.61 | 46.05 | -1.70 | 173.59 | 0.2613 | -850.4 | -161.8 |
| Flare | Date | Start | Peak | End | Dur [s] | Peak [c/s] | Total Counts | Energy [keV] | X pos [asec] | Y pos [asec] | Radial [asec] | B [deg] | L [deg] | Flags |
|---|---|---|---|---|---|---|---|---|---|---|---|---|---|---|
| 4071817 | 18-Jul-2004 | 17:19:20 | 17:20:22 | 17:32:48 | 808 | 92 | 88750 | 12-25 | -83 | -252 | 265 | -10.57 | 42.14 | A0 a1 DF ES P1 |
| 40718123 | 18-Jul-2004 | 17:32:48 | 17:35:06 | 17:42:48 | 600 | 19 | 9576 | 12-25 | -77 | -250 | 262 | -10.44 | 42.37 | A0 DF DR P1 |
| 4071892 | 18-Jul-2004 | 17:42:48 | 17:44:18 | 17:47:24 | 276 | 1 | 1001 | 6-12 | -69 | -245 | 254 | -10.13 | 42.77 | A0 DF P1 PE |
| 4071893 | 18-Jul-2004 | 17:47:24 | 17:50:58 | 17:51:08 | 224 | 13 | 4136 | 12-25 | -77 | -252 | 264 | -10.56 | 42.22 | A0 DF GE P1 PE |
| 4071865 | 18-Jul-2004 | 18:12:32 | 18:13:30 | 18:20:44 | 492 | 6 | 9163 | 6-12 | -52 | -248 | 254 | -10.31 | 43.53 | A0 DF GS P1 |
| 40718124 | 18-Jul-2004 | 18:20:44 | 18:22:50 | 18:24:48 | 244 | 4 | 3633 | 12-25 | -82 | -253 | 266 | -10.62 | 41.62 | A0 DF P1 |
| 4071866 | 18-Jul-2004 | 18:24:48 | 18:26:06 | 18:30:40 | 352 | 3 | 4016 | 6-12 | -48 | -243 | 248 | -10.00 | 43.66 | A0 DF P1 |
| 4071895 | 18-Jul-2004 | 18:59:56 | 19:02:06 | 19:03:40 | 224 | 56 | 44640 | 6-12 | -63 | -250 | 258 | -10.43 | 42.42 | A0 DF P1 |
| 4071896 | 18-Jul-2004 | 19:03:40 | 19:07:06 | 19:09:12 | 332 | 100 | 93552 | 6-12 | -67 | -251 | 260 | -10.49 | 42.13 | A0 DF P1 |
| 4071897 | 18-Jul-2004 | 19:16:40 | 19:21:14 | 19:22:52 | 372 | 120 | 133440 | 6-12 | -65 | -250 | 258 | -10.43 | 42.12 | A0 DF DR P1 |
| 4071823 | 18-Jul-2004 | 19:22:52 | 19:24:42 | 19:30:08 | 436 | 240 | 176016 | 12-25 | -78 | -254 | 266 | -10.68 | 41.30 | A0 DF P1 PE |
| Date | Start | Peak | End | Classification | B [deg] | LCM [deg] |
|---|---|---|---|---|---|---|
| 18-Jul-2004 | 17:04 | 17:13 | 17:15 | M1.9 | -10 | -05 |
| 18-Jul-2004 | 17:17 | 17:20 | 17:22 | C4.1 | -10 | -04 |
| 18-Jul-2004 | 17:49 | 17:54 | 17:57 | C1.2 | -10 | -04 |
| 18-Jul-2004 | 18:05 | 18:09 | 18:11 | C1.7 | -10 | -04 |
| 18-Jul-2004 | 18:43 | 18:47 | 18:53 | C2.3 | -10 | -03 |

