move the mouse pointer over that image.
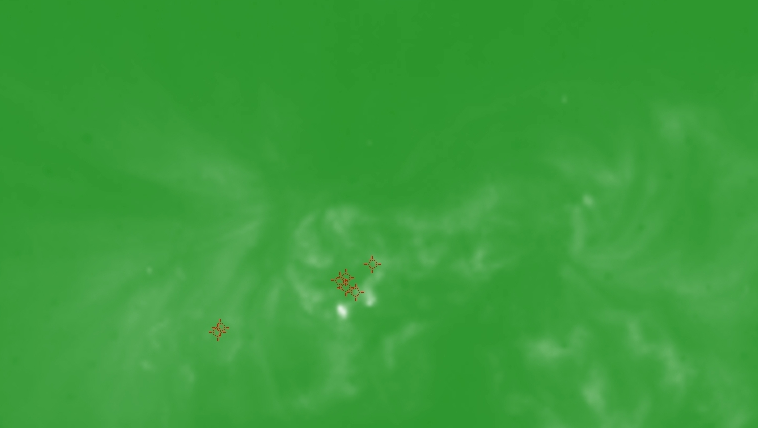
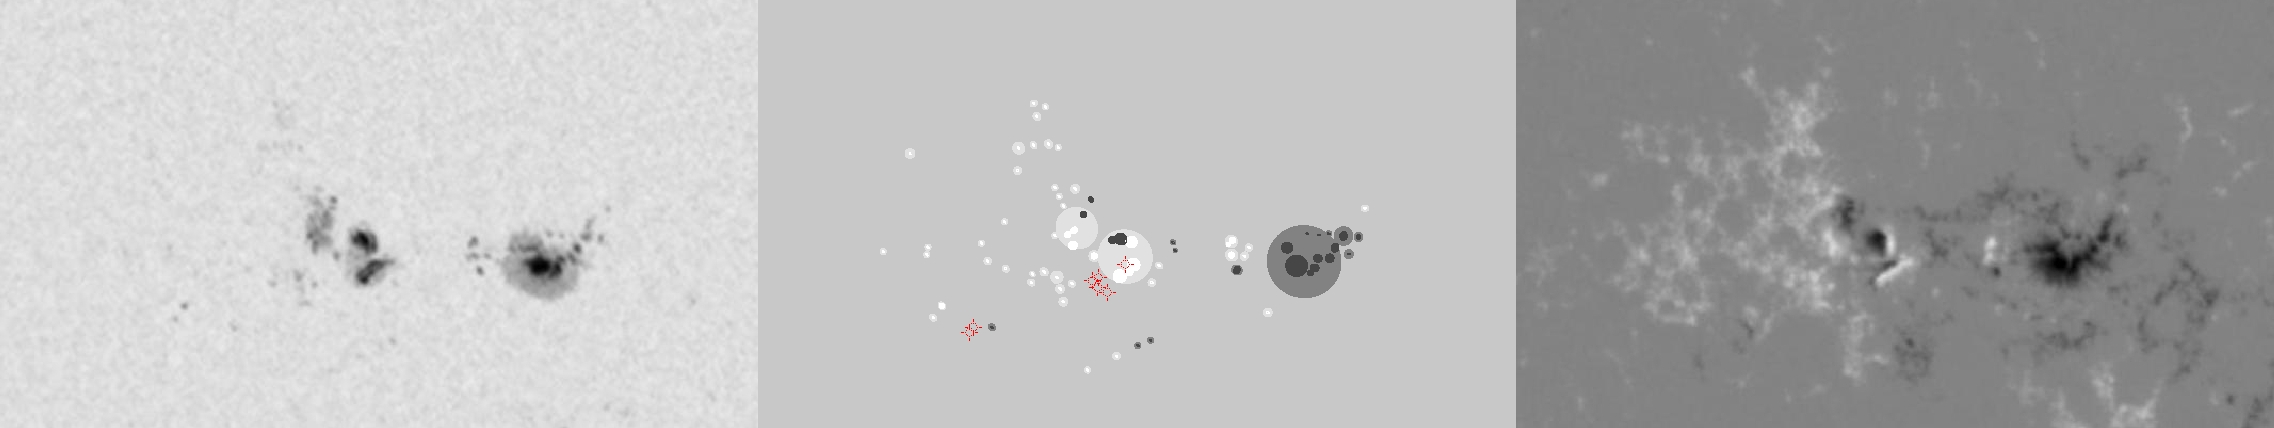
| Evolution of sunspot group NOAA 10649 and positions of flares in it animated by using the data of SOHO/MDI Debrecen Data (SDD) sunspot catalogue (lower panel, middle, ellipses with positions and areas corresponding to the relevant data of spots in SDD and with grey-scale colour coding of the magnetic polarities corresponding to that of the magnetograms), SOHO/MDI continuum images (lower panel, left) and magnetograms (lower panel, right), SOHO/EIT images (upper panel, middle), GOES and RHESSI flare data (red and blue symbols) observed within the interval around the time of SDD data. |
|
When you want to zoom in on one of the images, simply move the mouse pointer over that image. |
 |
| Year | Month | Day | Hour | Min | Sec | NOAA | Proj.U | Proj.WS | Corr.U | Corr.WS | B | L | LCM | Pos.angle | r | MU | MP |
|---|---|---|---|---|---|---|---|---|---|---|---|---|---|---|---|---|---|
| 2004 | 07 | 18 | 04 | 47 | 32 | 10649 | 225 | 1418 | 115 | 736 | -9.49 | 45.97 | -8.84 | 149.66 | 0.2959 | -648.8 | -184.4 |
| Flare | Date | Start | Peak | End | Dur [s] | Peak [c/s] | Total Counts | Energy [keV] | X pos [asec] | Y pos [asec] | Radial [asec] | B [deg] | L [deg] | Flags |
|---|---|---|---|---|---|---|---|---|---|---|---|---|---|---|
| 4071850 | 18-Jul-2004 | 03:57:48 | 04:04:30 | 04:06:12 | 504 | 11 | 10486 | 12-25 | -188 | -242 | 307 | -10.08 | 43.05 | A0 DF DR P1 PE |
| 4071873 | 18-Jul-2004 | 04:30:40 | 04:32:02 | 04:34:20 | 220 | 76 | 59280 | 6-12 | -275 | -282 | 395 | -12.66 | 37.21 | A0 DF P1 |
| 40718112 | 18-Jul-2004 | 04:34:20 | 04:37:10 | 04:41:00 | 400 | 80 | 108144 | 6-12 | -276 | -285 | 397 | -12.85 | 37.09 | A0 DF P1 |
| 40718113 | 18-Jul-2004 | 04:41:00 | 04:52:26 | 04:57:48 | 1008 | 88 | 170808 | 6-12 | -191 | -257 | 321 | -11.00 | 42.39 | A0 DF DR P1 PE |
| 4071875 | 18-Jul-2004 | 04:57:48 | 04:59:18 | 05:05:04 | 436 | 32 | 45576 | 6-12 | -183 | -260 | 318 | -11.18 | 42.81 | A0 DF DR P1 PE |
| 4071851 | 18-Jul-2004 | 05:05:04 | 05:15:34 | 05:19:24 | 860 | 448 | 422832 | 12-25 | -184 | -251 | 312 | -10.62 | 42.62 | A0 DF DR P1 |
| 4071834 | 18-Jul-2004 | 05:33:04 | 05:34:42 | 05:38:00 | 296 | 10 | 11184 | 6-12 | -182 | -253 | 312 | -10.74 | 42.56 | A0 DF DR P1 |
| Date | Start | Peak | End | Classification | B [deg] | LCM [deg] |
|---|---|---|---|---|---|---|
| No data |

