move the mouse pointer over that image.
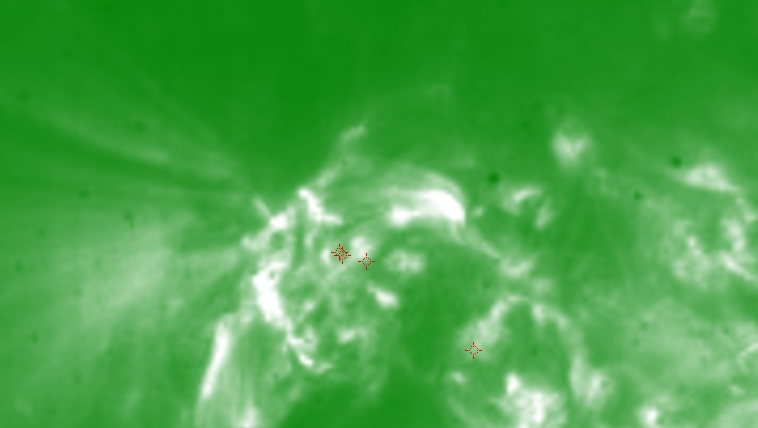
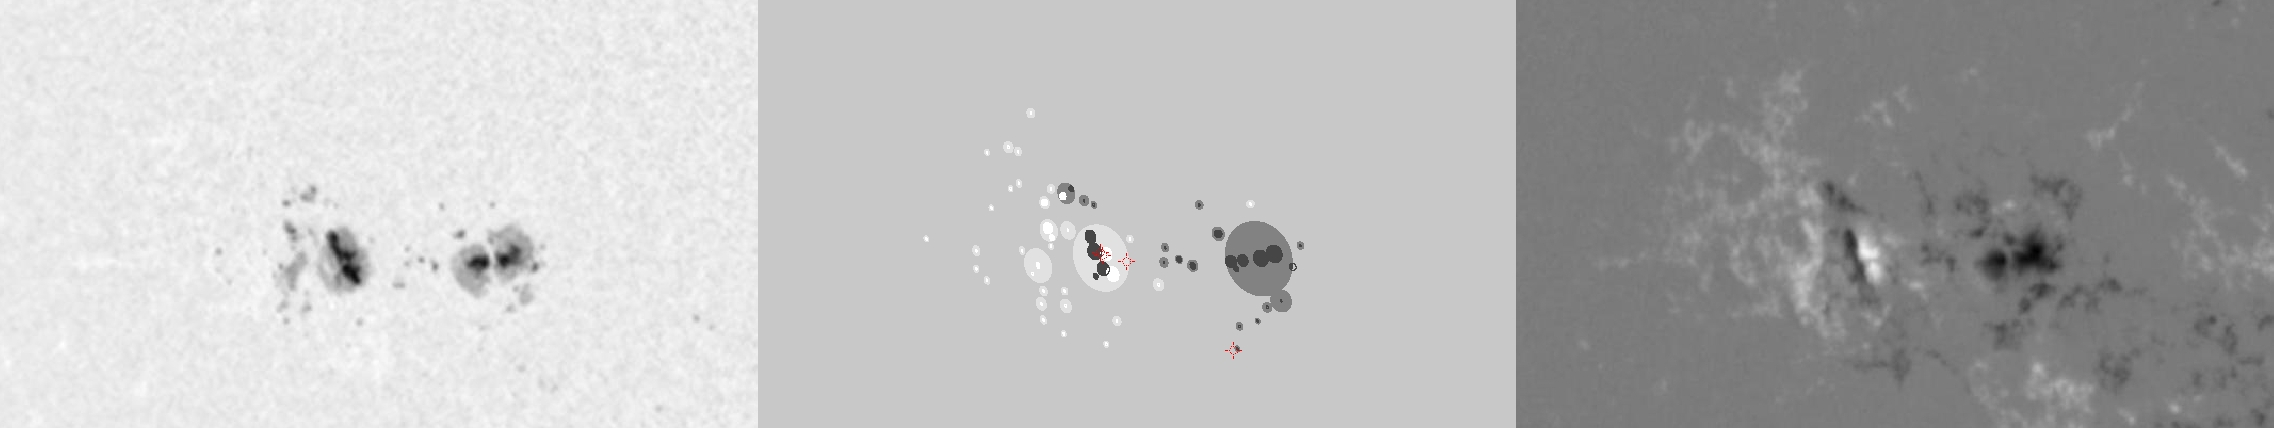
| Evolution of sunspot group NOAA 10649 and positions of flares in it animated by using the data of SOHO/MDI Debrecen Data (SDD) sunspot catalogue (lower panel, middle, ellipses with positions and areas corresponding to the relevant data of spots in SDD and with grey-scale colour coding of the magnetic polarities corresponding to that of the magnetograms), SOHO/MDI continuum images (lower panel, left) and magnetograms (lower panel, right), SOHO/EIT images (upper panel, middle), GOES and RHESSI flare data (red and blue symbols) observed within the interval around the time of SDD data. |
|
When you want to zoom in on one of the images, simply move the mouse pointer over that image. |
 |
| Year | Month | Day | Hour | Min | Sec | NOAA | Proj.U | Proj.WS | Corr.U | Corr.WS | B | L | LCM | Pos.angle | r | MU | MP |
|---|---|---|---|---|---|---|---|---|---|---|---|---|---|---|---|---|---|
| 2004 | 07 | 16 | 06 | 23 | 32 | 10649 | 225 | 1416 | 139 | 884 | -9.64 | 45.71 | -34.70 | 112.59 | 0.6080 | -477.4 | -37.6 |
| Flare | Date | Start | Peak | End | Dur [s] | Peak [c/s] | Total Counts | Energy [keV] | X pos [asec] | Y pos [asec] | Radial [asec] | B [deg] | L [deg] | Flags |
|---|---|---|---|---|---|---|---|---|---|---|---|---|---|---|
| 4071675 | 16-Jul-2004 | 06:10:12 | 06:15:26 | 06:18:28 | 496 | 56 | 49224 | 6-12 | -565 | -219 | 606 | -9.64 | 43.20 | A0 DF P1 |
| 4071653 | 16-Jul-2004 | 06:18:28 | 06:20:54 | 06:25:12 | 404 | 28 | 38832 | 6-12 | -562 | -221 | 604 | -9.75 | 43.36 | A0 DF P1 Q2 |
| 4071654 | 16-Jul-2004 | 06:31:28 | 06:32:34 | 06:35:12 | 224 | 22 | 22224 | 6-12 | -544 | -225 | 589 | -9.94 | 44.57 | A0 DF DR GS P1 |
| 4071657 | 16-Jul-2004 | 07:01:48 | 07:05:58 | 07:12:20 | 632 | 27 | 46880 | 6-12 | -468 | -281 | 546 | -13.18 | 49.32 | A0 DF DR P1 |
| Date | Start | Peak | End | Classification | B [deg] | LCM [deg] |
|---|---|---|---|---|---|---|
| No data |

