move the mouse pointer over that image.
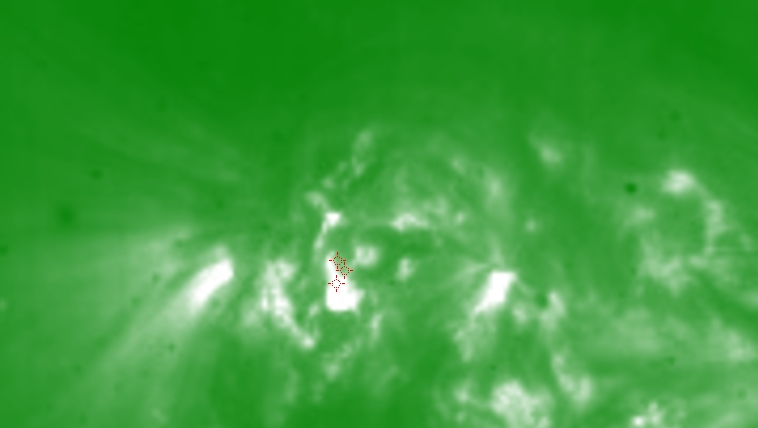
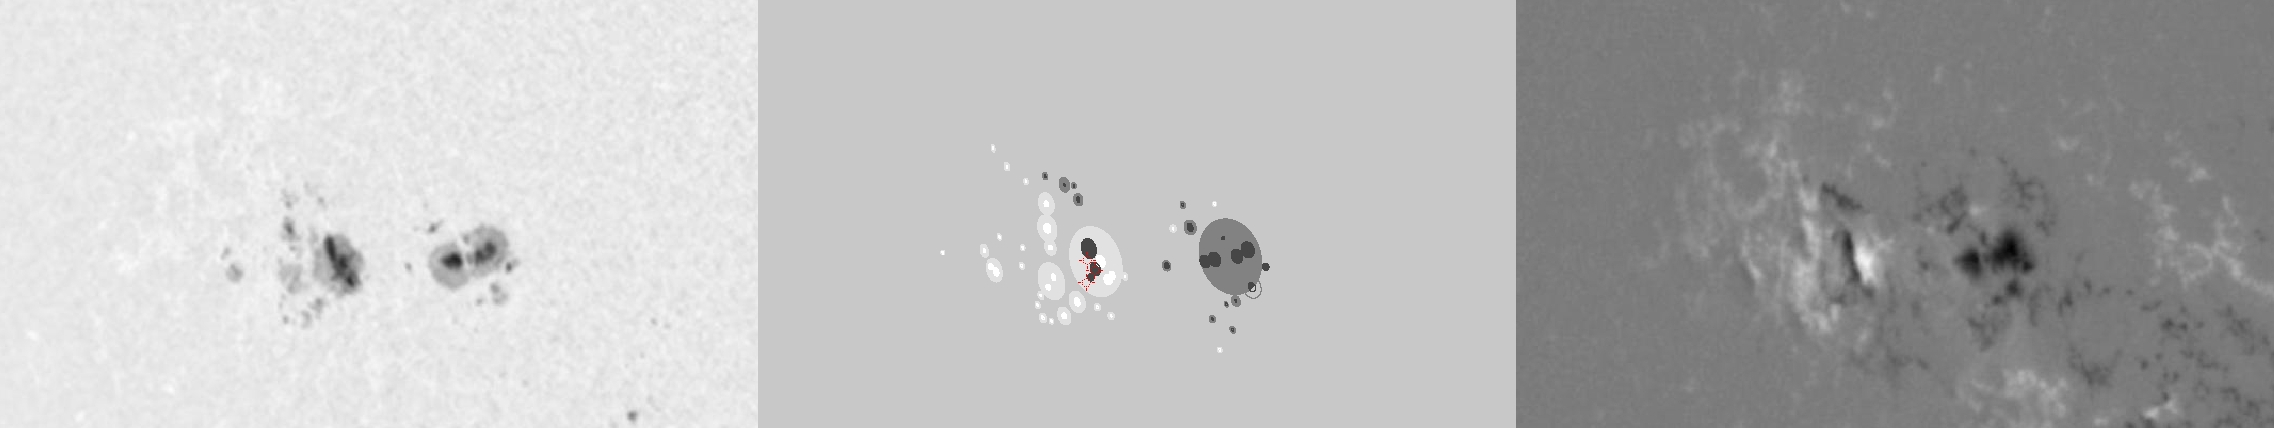
| Evolution of sunspot group NOAA 10649 and positions of flares in it animated by using the data of SOHO/MDI Debrecen Data (SDD) sunspot catalogue (lower panel, middle, ellipses with positions and areas corresponding to the relevant data of spots in SDD and with grey-scale colour coding of the magnetic polarities corresponding to that of the magnetograms), SOHO/MDI continuum images (lower panel, left) and magnetograms (lower panel, right), SOHO/EIT images (upper panel, middle), GOES and RHESSI flare data (red and blue symbols) observed within the interval around the time of SDD data. |
|
When you want to zoom in on one of the images, simply move the mouse pointer over that image. |
 |
| Year | Month | Day | Hour | Min | Sec | NOAA | Proj.U | Proj.WS | Corr.U | Corr.WS | B | L | LCM | Pos.angle | r | MU | MP |
|---|---|---|---|---|---|---|---|---|---|---|---|---|---|---|---|---|---|
| 2004 | 07 | 15 | 17 | 35 | 32 | 10649 | 206 | 1392 | 143 | 970 | -9.84 | 45.07 | -42.40 | 108.99 | 0.7028 | -455.9 | 11.8 |
| Flare | Date | Start | Peak | End | Dur [s] | Peak [c/s] | Total Counts | Energy [keV] | X pos [asec] | Y pos [asec] | Radial [asec] | B [deg] | L [deg] | Flags |
|---|---|---|---|---|---|---|---|---|---|---|---|---|---|---|
| 4071535 | 15-Jul-2004 | 17:13:28 | 17:16:50 | 17:19:56 | 388 | 0 | 771 | 6-12 | -657 | -224 | 694 | -10.36 | 42.93 | A0 DF P1 |
| 4071594 | 15-Jul-2004 | 17:19:56 | 17:42:34 | 17:51:40 | 1904 | 2 | 10005 | 6-12 | -656 | -218 | 691 | -9.99 | 42.84 | A0 DF GE P1 PE |
| 4071514 | 15-Jul-2004 | 18:14:16 | 18:23:30 | 18:27:36 | 800 | 4844 | 4827398 | 100-300 | -648 | -233 | 689 | -10.88 | 42.98 | a0 a1 A3 DF EE GS P1 |
| Date | Start | Peak | End | Classification | B [deg] | LCM [deg] |
|---|---|---|---|---|---|---|
| No data |

