move the mouse pointer over that image.
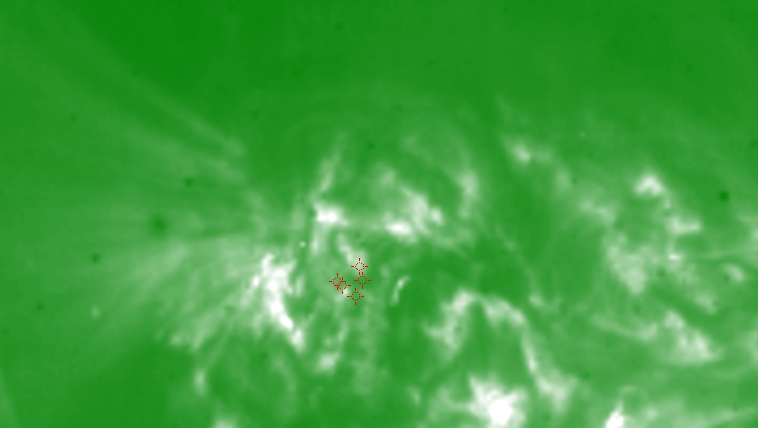
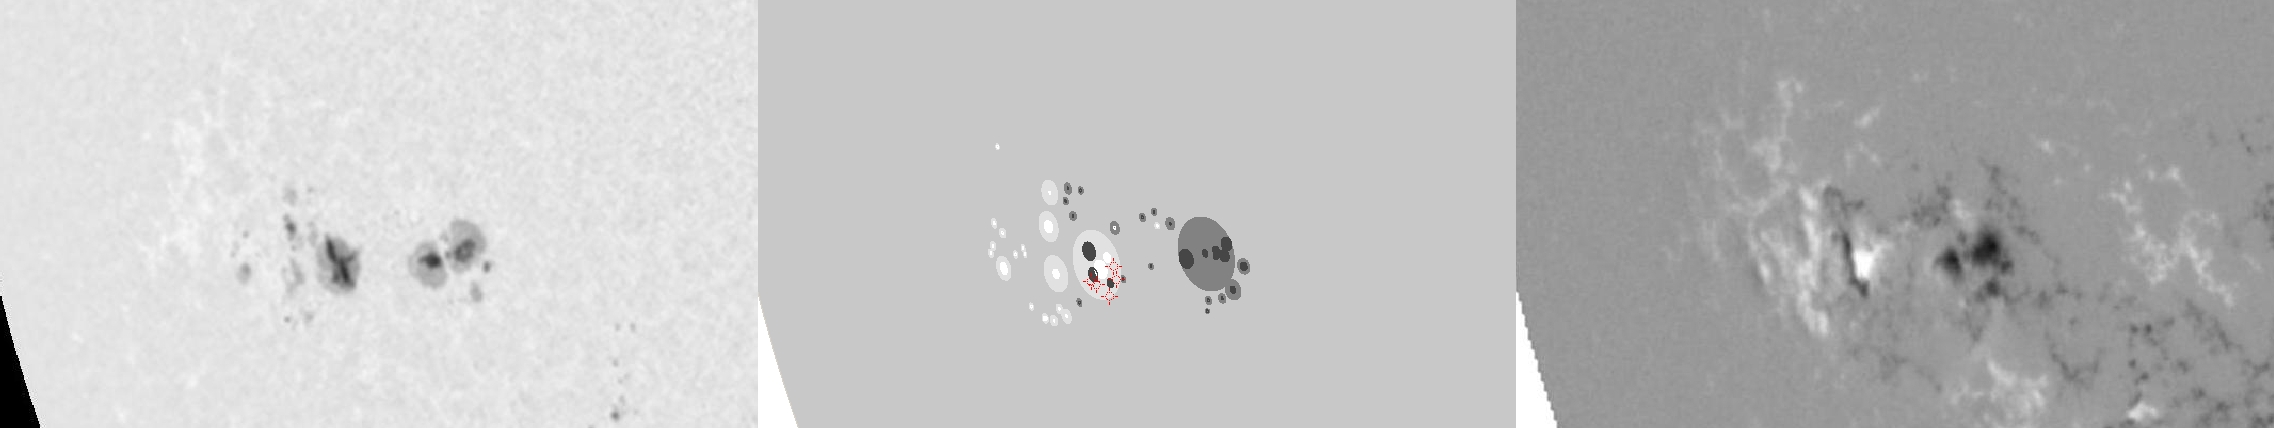
| Evolution of sunspot group NOAA 10649 and positions of flares in it animated by using the data of SOHO/MDI Debrecen Data (SDD) sunspot catalogue (lower panel, middle, ellipses with positions and areas corresponding to the relevant data of spots in SDD and with grey-scale colour coding of the magnetic polarities corresponding to that of the magnetograms), SOHO/MDI continuum images (lower panel, left) and magnetograms (lower panel, right), SOHO/EIT images (upper panel, middle), GOES and RHESSI flare data (red and blue symbols) observed within the interval around the time of SDD data. |
|
When you want to zoom in on one of the images, simply move the mouse pointer over that image. |
 |
| Year | Month | Day | Hour | Min | Sec | NOAA | Proj.U | Proj.WS | Corr.U | Corr.WS | B | L | LCM | Pos.angle | r | MU | MP |
|---|---|---|---|---|---|---|---|---|---|---|---|---|---|---|---|---|---|
| 2004 | 07 | 15 | 07 | 59 | 32 | 10649 | 178 | 1188 | 135 | 913 | -9.76 | 44.99 | -47.77 | 106.86 | 0.7626 | -277.2 | 4.1 |
| Flare | Date | Start | Peak | End | Dur [s] | Peak [c/s] | Total Counts | Energy [keV] | X pos [asec] | Y pos [asec] | Radial [asec] | B [deg] | L [deg] | Flags |
|---|---|---|---|---|---|---|---|---|---|---|---|---|---|---|
| 4071561 | 15-Jul-2004 | 07:06:48 | 07:12:22 | 07:13:44 | 416 | 20 | 20616 | 6-12 | -709 | -216 | 741 | -10.15 | 43.96 | A0 DF DR P1 |
| 4071564 | 15-Jul-2004 | 08:22:08 | 08:22:42 | 08:23:28 | 80 | 38 | 7584 | 6-12 | -706 | -229 | 742 | -10.94 | 43.42 | A0 DF DR P1 |
| 4071507 | 15-Jul-2004 | 08:24:36 | 08:25:50 | 08:28:16 | 220 | 168 | 50736 | 12-25 | -697 | -236 | 737 | -11.33 | 44.13 | A0 DF DR P1 |
| 4071565 | 15-Jul-2004 | 08:28:16 | 08:29:42 | 08:32:32 | 256 | 20 | 17784 | 6-12 | -708 | -227 | 744 | -10.83 | 43.20 | A0 DF DR P1 |
| 4071566 | 15-Jul-2004 | 08:38:48 | 08:39:42 | 08:40:52 | 124 | 9 | 4872 | 6-12 | -690 | -226 | 726 | -10.67 | 44.77 | A0 DF P1 |
| Date | Start | Peak | End | Classification | B [deg] | LCM [deg] |
|---|---|---|---|---|---|---|
| No data |

