move the mouse pointer over that image.
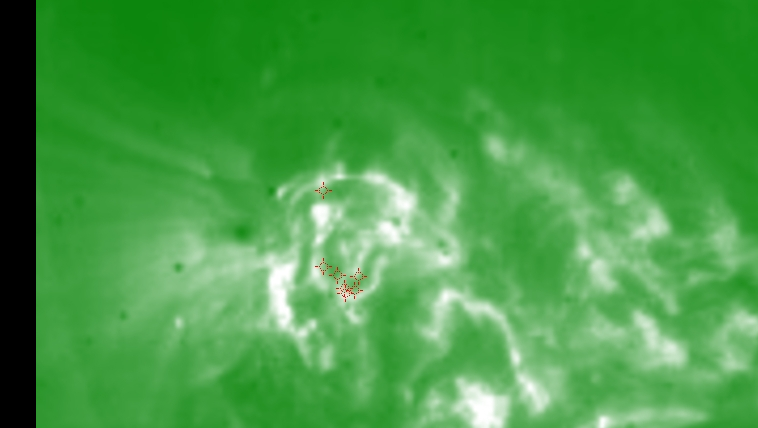
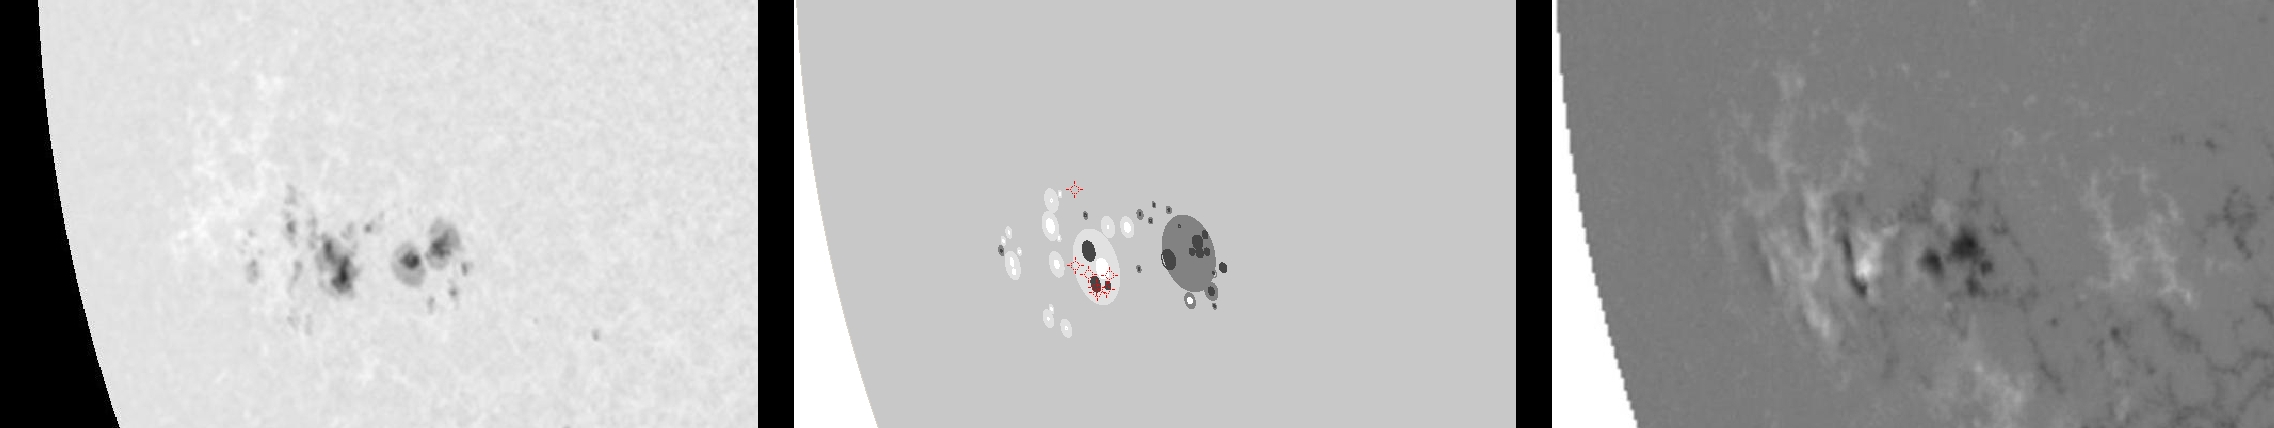
| Evolution of sunspot group NOAA 10649 and positions of flares in it animated by using the data of SOHO/MDI Debrecen Data (SDD) sunspot catalogue (lower panel, middle, ellipses with positions and areas corresponding to the relevant data of spots in SDD and with grey-scale colour coding of the magnetic polarities corresponding to that of the magnetograms), SOHO/MDI continuum images (lower panel, left) and magnetograms (lower panel, right), SOHO/EIT images (upper panel, middle), GOES and RHESSI flare data (red and blue symbols) observed within the interval around the time of SDD data. |
|
When you want to zoom in on one of the images, simply move the mouse pointer over that image. |
 |
| Year | Month | Day | Hour | Min | Sec | NOAA | Proj.U | Proj.WS | Corr.U | Corr.WS | B | L | LCM | Pos.angle | r | MU | MP |
|---|---|---|---|---|---|---|---|---|---|---|---|---|---|---|---|---|---|
| 2004 | 07 | 14 | 22 | 23 | 32 | 10649 | 178 | 1130 | 151 | 973 | -9.79 | 45.04 | -53.01 | 105.32 | 0.8163 | -274.4 | 15.2 |
| Flare | Date | Start | Peak | End | Dur [s] | Peak [c/s] | Total Counts | Energy [keV] | X pos [asec] | Y pos [asec] | Radial [asec] | B [deg] | L [deg] | Flags |
|---|---|---|---|---|---|---|---|---|---|---|---|---|---|---|
| 4071489 | 14-Jul-2004 | 21:31:52 | 21:36:10 | 21:36:52 | 300 | 1 | 1069 | 6-12 | -771 | -227 | 803 | -11.23 | 42.90 | A0 DF P1 |
| 4071443 | 14-Jul-2004 | 22:00:08 | 22:05:14 | 22:20:24 | 1216 | 304 | 866496 | 6-12 | -780 | -163 | 797 | -7.33 | 42.60 | A0 DF P1 |
| 40714128 | 14-Jul-2004 | 22:20:24 | 22:22:06 | 22:25:40 | 316 | 46 | 65280 | 6-12 | -755 | -217 | 786 | -10.50 | 44.33 | A0 DF P1 |
| 4071490 | 14-Jul-2004 | 22:25:40 | 22:29:34 | 22:33:32 | 472 | 192 | 234624 | 12-25 | -756 | -226 | 789 | -11.07 | 44.01 | A0 DF DR P1 |
| 4071492 | 14-Jul-2004 | 22:41:04 | 22:43:02 | 22:50:08 | 544 | 120 | 126096 | 6-12 | -760 | -225 | 793 | -11.03 | 43.49 | A0 DF P1 |
| 4071444 | 14-Jul-2004 | 22:50:08 | 22:51:30 | 22:52:48 | 160 | 22 | 16344 | 6-12 | -763 | -217 | 793 | -10.55 | 43.23 | A0 DF P1 |
| 4071445 | 14-Jul-2004 | 22:57:40 | 23:07:10 | 23:13:04 | 924 | 464 | 1177704 | 12-25 | -769 | -212 | 797 | -10.28 | 42.53 | A0 DF P1 PE |
| Date | Start | Peak | End | Classification | B [deg] | LCM [deg] |
|---|---|---|---|---|---|---|
| No data |

