move the mouse pointer over that image.
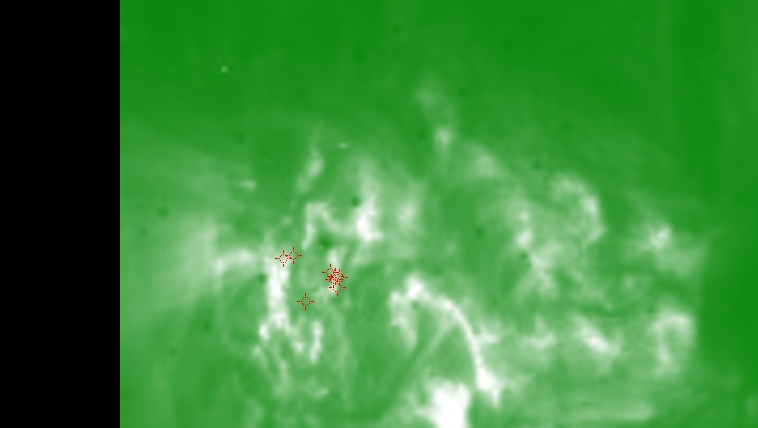
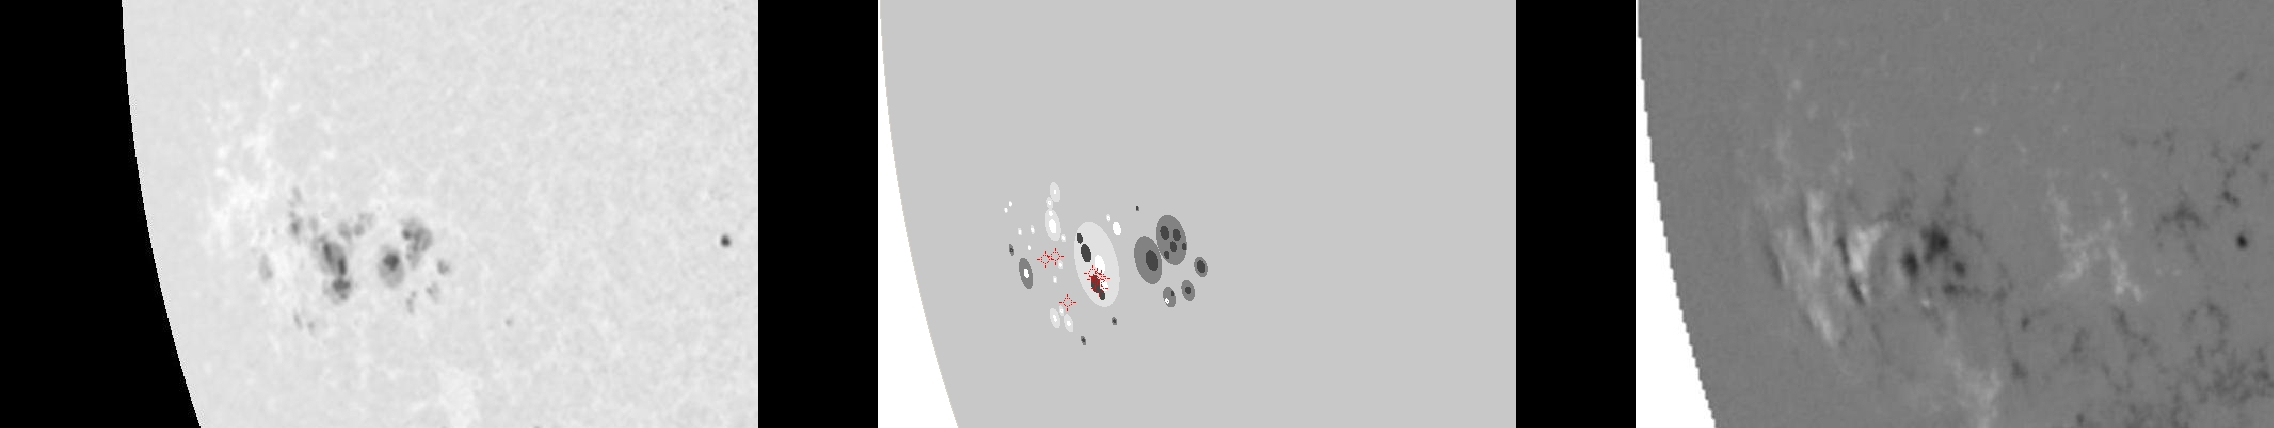
| Evolution of sunspot group NOAA 10649 and positions of flares in it animated by using the data of SOHO/MDI Debrecen Data (SDD) sunspot catalogue (lower panel, middle, ellipses with positions and areas corresponding to the relevant data of spots in SDD and with grey-scale colour coding of the magnetic polarities corresponding to that of the magnetograms), SOHO/MDI continuum images (lower panel, left) and magnetograms (lower panel, right), SOHO/EIT images (upper panel, middle), GOES and RHESSI flare data (red and blue symbols) observed within the interval around the time of SDD data. |
|
When you want to zoom in on one of the images, simply move the mouse pointer over that image. |
 |
| Year | Month | Day | Hour | Min | Sec | NOAA | Proj.U | Proj.WS | Corr.U | Corr.WS | B | L | LCM | Pos.angle | r | MU | MP |
|---|---|---|---|---|---|---|---|---|---|---|---|---|---|---|---|---|---|
| 2004 | 07 | 14 | 11 | 11 | 32 | 10649 | 149 | 888 | 149 | 907 | -9.91 | 44.67 | -59.57 | 103.87 | 0.8750 | -223.9 | 31.1 |
| Flare | Date | Start | Peak | End | Dur [s] | Peak [c/s] | Total Counts | Energy [keV] | X pos [asec] | Y pos [asec] | Radial [asec] | B [deg] | L [deg] | Flags |
|---|---|---|---|---|---|---|---|---|---|---|---|---|---|---|
| 4071464 | 14-Jul-2004 | 10:47:24 | 10:48:10 | 10:49:56 | 152 | 42 | 25920 | 6-12 | -852 | -200 | 875 | -10.21 | 39.41 | A0 DF DR P1 |
| 40714115 | 14-Jul-2004 | 10:49:56 | 10:51:50 | 11:00:08 | 612 | 56 | 73728 | 6-12 | -845 | -198 | 868 | -10.02 | 40.41 | A0 DF DR P1 |
| 40714116 | 14-Jul-2004 | 11:00:08 | 11:02:02 | 11:04:28 | 260 | 13 | 12864 | 6-12 | -836 | -227 | 867 | -11.76 | 40.87 | A0 DF P1 |
| 4071466 | 14-Jul-2004 | 11:38:04 | 11:42:14 | 11:44:44 | 400 | 22 | 16824 | 6-12 | -810 | -219 | 840 | -11.04 | 44.04 | A0 DF DR P1 |
| 40714117 | 14-Jul-2004 | 11:44:44 | 11:46:10 | 11:48:44 | 240 | 15 | 10776 | 6-12 | -808 | -213 | 835 | -10.64 | 44.37 | A0 DF P1 |
| 40714118 | 14-Jul-2004 | 11:48:44 | 11:50:34 | 11:52:20 | 216 | 9 | 7368 | 6-12 | -810 | -212 | 837 | -10.60 | 44.11 | A0 DF P1 |
| 4071467 | 14-Jul-2004 | 11:52:20 | 11:55:46 | 11:57:32 | 312 | 104 | 37728 | 6-12 | -812 | -210 | 839 | -10.49 | 43.86 | A0 DF P1 |
| 4071468 | 14-Jul-2004 | 11:57:32 | 11:58:26 | 12:00:04 | 152 | 34 | 18432 | 6-12 | -810 | -214 | 838 | -10.72 | 43.99 | A0 DF P1 |
| Date | Start | Peak | End | Classification | B [deg] | LCM [deg] |
|---|---|---|---|---|---|---|
| No data |

