move the mouse pointer over that image.
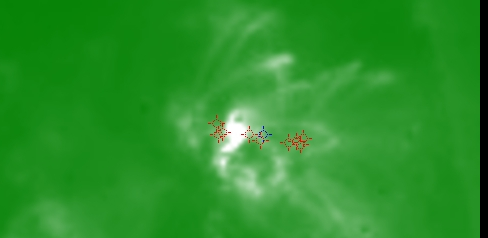
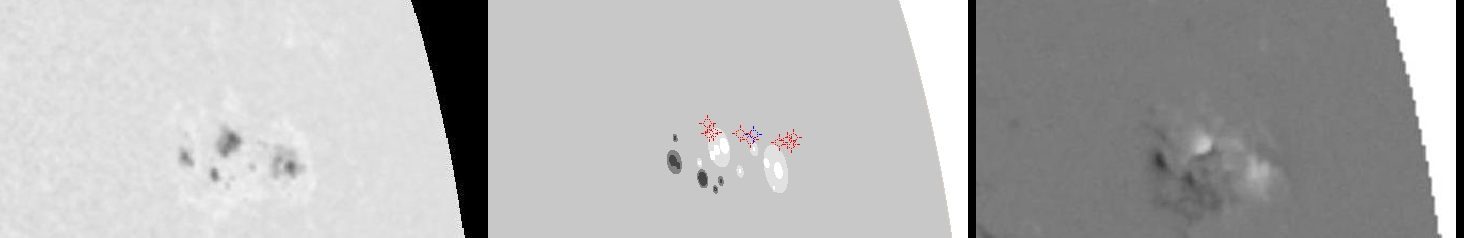
| Evolution of sunspot group NOAA 10646 and positions of flares in it animated by using the data of SOHO/MDI Debrecen Data (SDD) sunspot catalogue (lower panel, middle, ellipses with positions and areas corresponding to the relevant data of spots in SDD and with grey-scale colour coding of the magnetic polarities corresponding to that of the magnetograms), SOHO/MDI continuum images (lower panel, left) and magnetograms (lower panel, right), SOHO/EIT images (upper panel, middle), GOES and RHESSI flare data (red and blue symbols) observed within the interval around the time of SDD data. |
|
When you want to zoom in on one of the images, simply move the mouse pointer over that image. |
 |
| Year | Month | Day | Hour | Min | Sec | NOAA | Proj.U | Proj.WS | Corr.U | Corr.WS | B | L | LCM | Pos.angle | r | MU | MP |
|---|---|---|---|---|---|---|---|---|---|---|---|---|---|---|---|---|---|
| 2004 | 07 | 13 | 23 | 59 | 32 | 10646 | 56 | 285 | 56 | 289 | 13.14 | 171.22 | 60.81 | 282.71 | 0.8725 | 301.9 | 223.2 |
| Flare | Date | Start | Peak | End | Dur [s] | Peak [c/s] | Total Counts | Energy [keV] | X pos [asec] | Y pos [asec] | Radial [asec] | B [deg] | L [deg] | Flags |
|---|---|---|---|---|---|---|---|---|---|---|---|---|---|---|
| 4071332 | 13-Jul-2004 | 23:34:24 | 23:35:30 | 23:41:08 | 404 | 1200 | 1264325 | 12-25 | 800 | 201 | 825 | 14.23 | 169.04 | A0 a1 DF P1 |
| 40713131 | 13-Jul-2004 | 23:41:08 | 23:43:30 | 00:06:28 | 1520 | 688 | 1786272 | 12-25 | 804 | 202 | 829 | 14.26 | 169.47 | A0 DF DR P1 |
| 40713102 | 14-Jul-2004 | 00:06:28 | 00:08:06 | 00:09:40 | 192 | 52 | 53136 | 6-12 | 852 | 197 | 874 | 13.57 | 175.40 | A0 DF DR P1 |
| 4071429 | 14-Jul-2004 | 00:09:40 | 00:14:02 | 00:16:12 | 392 | 72 | 111696 | 6-12 | 848 | 196 | 871 | 13.55 | 174.73 | A0 DF DR P1 |
| 40714103 | 14-Jul-2004 | 00:16:12 | 00:19:10 | 00:19:12 | 180 | 52 | 46224 | 6-12 | 857 | 199 | 880 | 13.64 | 176.10 | A0 DF DR P1 |
| 40714104 | 14-Jul-2004 | 00:19:12 | 00:21:46 | 00:26:36 | 444 | 56 | 105456 | 6-12 | 856 | 195 | 878 | 13.41 | 175.80 | A0 DF DR P1 |
| 40714105 | 14-Jul-2004 | 00:26:36 | 00:29:42 | 00:31:36 | 300 | 60 | 76368 | 6-12 | 833 | 198 | 856 | 13.80 | 172.58 | A0 DF P1 |
| 4071446 | 14-Jul-2004 | 00:31:36 | 00:33:10 | 00:35:44 | 248 | 56 | 69744 | 6-12 | 827 | 202 | 852 | 14.08 | 171.88 | A0 DF P1 |
| 40714106 | 14-Jul-2004 | 00:35:44 | 00:43:38 | 00:46:48 | 664 | 1904 | 2142744 | 12-25 | 809 | 209 | 836 | 14.64 | 169.71 | A0 DF P1 |
| Date | Start | Peak | End | Classification | B [deg] | LCM [deg] |
|---|---|---|---|---|---|---|
| 13-Jul-2004 | 23:27 | 23:33 | 23:37 | C3.2 | 14 | 62 |

