move the mouse pointer over that image.
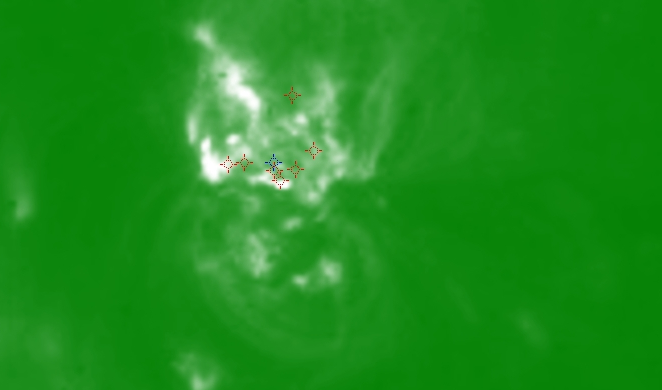
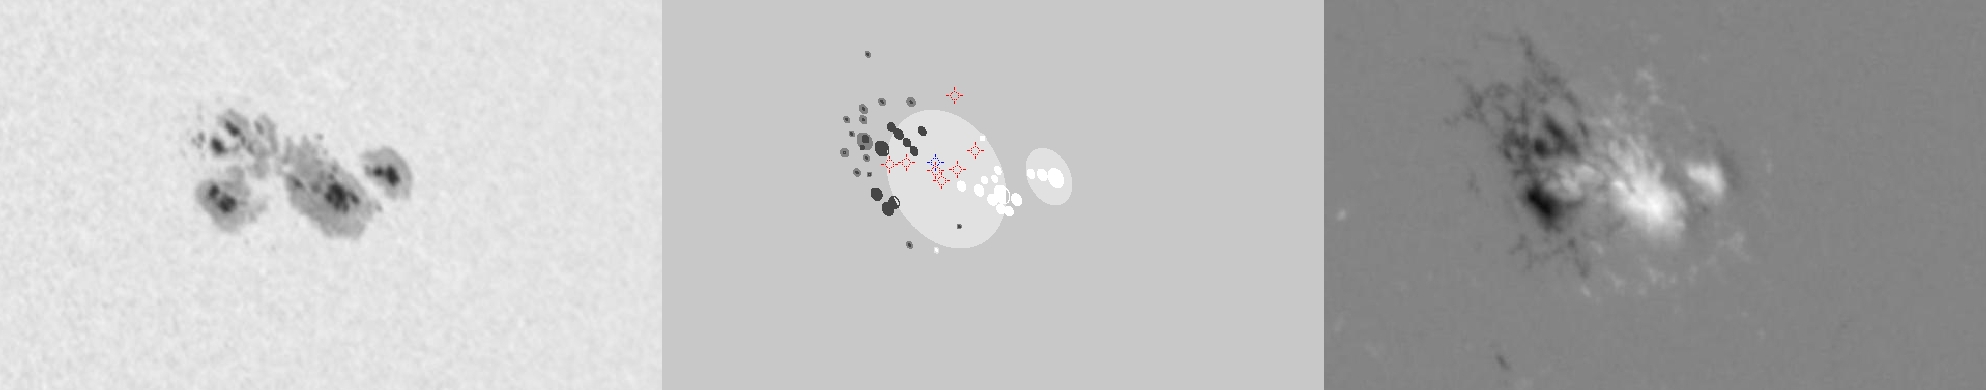
| Evolution of sunspot group NOAA 10564 and positions of flares in it animated by using the data of SOHO/MDI Debrecen Data (SDD) sunspot catalogue (lower panel, middle, ellipses with positions and areas corresponding to the relevant data of spots in SDD and with grey-scale colour coding of the magnetic polarities corresponding to that of the magnetograms), SOHO/MDI continuum images (lower panel, left) and magnetograms (lower panel, right), SOHO/EIT images (upper panel, middle), GOES and RHESSI flare data (red and blue symbols) observed within the interval around the time of SDD data. |
|
When you want to zoom in on one of the images, simply move the mouse pointer over that image. |
 |
| Year | Month | Day | Hour | Min | Sec | NOAA | Proj.U | Proj.WS | Corr.U | Corr.WS | B | L | LCM | Pos.angle | r | MU | MP |
|---|---|---|---|---|---|---|---|---|---|---|---|---|---|---|---|---|---|
| 2004 | 02 | 27 | 15 | 58 | 33 | 10564 | 260 | 2047 | 174 | 1372 | 13.46 | 162.14 | 37.12 | 299.34 | 0.6746 | 263.1 | 177.0 |
| Flare | Date | Start | Peak | End | Dur [s] | Peak [c/s] | Total Counts | Energy [keV] | X pos [asec] | Y pos [asec] | Radial [asec] | B [deg] | L [deg] | Flags |
|---|---|---|---|---|---|---|---|---|---|---|---|---|---|---|
| 4022786 | 27-Feb-2004 | 11:53:48 | 11:54:14 | 11:55:16 | 88 | 14 | 5640 | 6-12 | 513 | 325 | 608 | 13.78 | 159.79 | A0 DF P1 |
| 4022756 | 27-Feb-2004 | 13:15:20 | 13:16:06 | 13:18:56 | 216 | 30 | 21744 | 6-12 | 545 | 335 | 639 | 14.61 | 161.57 | A0 DF DR P1 |
| 4022711 | 27-Feb-2004 | 13:26:56 | 13:27:42 | 13:31:52 | 296 | 136 | 62232 | 12-25 | 526 | 316 | 614 | 13.28 | 159.81 | A0 DF P1 |
| 4022725 | 27-Feb-2004 | 13:31:52 | 13:34:38 | 13:40:16 | 504 | 60 | 59736 | 6-12 | 524 | 322 | 615 | 13.65 | 159.66 | A0 DF P1 |
| 4022787 | 27-Feb-2004 | 14:20:36 | 14:23:46 | 14:31:32 | 656 | 24 | 52320 | 6-12 | 548 | 368 | 660 | 16.78 | 161.64 | A0 DF DR P1 |
| 4022759 | 27-Feb-2004 | 15:58:56 | 16:01:06 | 16:05:44 | 408 | 76 | 69024 | 6-12 | 541 | 324 | 631 | 13.87 | 159.63 | A0 DF DR P1 |
| 4022764 | 27-Feb-2004 | 17:35:12 | 17:36:38 | 17:38:12 | 180 | 22 | 14664 | 6-12 | 554 | 321 | 640 | 13.75 | 159.72 | A0 DF DR P1 |
| Date | Start | Peak | End | Classification | B [deg] | LCM [deg] |
|---|---|---|---|---|---|---|
| 27-Feb-2004 | 14:06 | 14:10 | 14:15 | B8.0 | 14 | 35 |

