move the mouse pointer over that image.
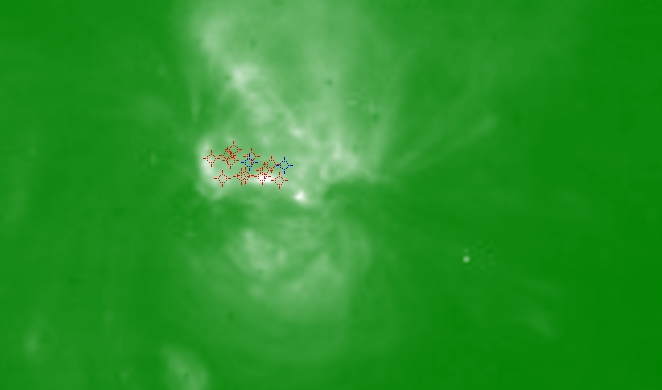
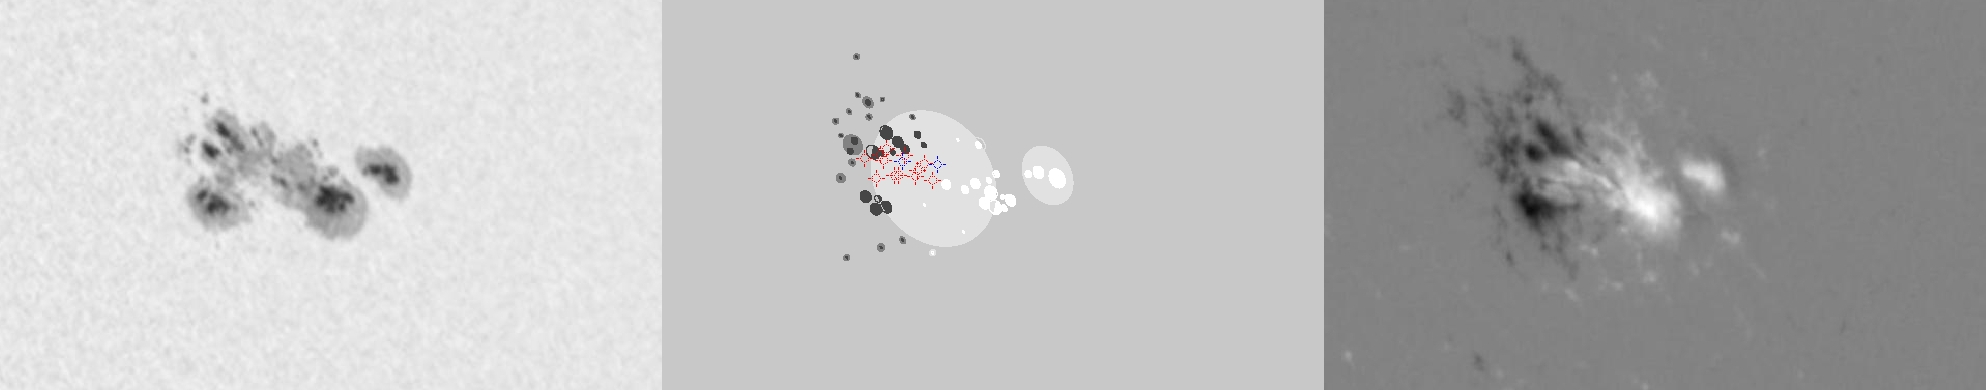
| Evolution of sunspot group NOAA 10564 and positions of flares in it animated by using the data of SOHO/MDI Debrecen Data (SDD) sunspot catalogue (lower panel, middle, ellipses with positions and areas corresponding to the relevant data of spots in SDD and with grey-scale colour coding of the magnetic polarities corresponding to that of the magnetograms), SOHO/MDI continuum images (lower panel, left) and magnetograms (lower panel, right), SOHO/EIT images (upper panel, middle), GOES and RHESSI flare data (red and blue symbols) observed within the interval around the time of SDD data. |
|
When you want to zoom in on one of the images, simply move the mouse pointer over that image. |
 |
| Year | Month | Day | Hour | Min | Sec | NOAA | Proj.U | Proj.WS | Corr.U | Corr.WS | B | L | LCM | Pos.angle | r | MU | MP |
|---|---|---|---|---|---|---|---|---|---|---|---|---|---|---|---|---|---|
| 2004 | 02 | 27 | 06 | 23 | 33 | 10564 | 288 | 2204 | 181 | 1379 | 13.50 | 162.00 | 31.71 | 303.41 | 0.6137 | 185.6 | 190.5 |
| Flare | Date | Start | Peak | End | Dur [s] | Peak [c/s] | Total Counts | Energy [keV] | X pos [asec] | Y pos [asec] | Radial [asec] | B [deg] | L [deg] | Flags |
|---|---|---|---|---|---|---|---|---|---|---|---|---|---|---|
| 4022783 | 27-Feb-2004 | 05:36:00 | 05:37:34 | 05:41:28 | 328 | 28 | 38880 | 6-12 | 480 | 321 | 577 | 13.36 | 160.78 | A0 DR P1 |
| 4022745 | 27-Feb-2004 | 05:42:20 | 05:45:42 | 05:46:24 | 244 | 144 | 97248 | 6-12 | 477 | 331 | 581 | 13.99 | 160.58 | A0 DR P1 |
| 4022746 | 27-Feb-2004 | 06:36:48 | 06:36:54 | 06:39:56 | 188 | 22 | 17952 | 6-12 | 474 | 323 | 573 | 13.46 | 159.83 | A0 GS P1 |
| 4022784 | 27-Feb-2004 | 06:39:56 | 06:41:34 | 06:43:48 | 232 | 28 | 24576 | 6-12 | 487 | 326 | 586 | 13.72 | 160.75 | A0 |
| 4022721 | 27-Feb-2004 | 06:43:48 | 06:47:02 | 06:52:48 | 540 | 160 | 147648 | 6-12 | 487 | 322 | 584 | 13.46 | 160.66 | A0 |
| 4022785 | 27-Feb-2004 | 07:00:44 | 07:01:18 | 07:04:56 | 252 | 76 | 61056 | 6-12 | 473 | 339 | 582 | 14.48 | 159.68 | A0 |
| 4022722 | 27-Feb-2004 | 07:04:56 | 07:09:50 | 07:15:28 | 632 | 256 | 293424 | 6-12 | 480 | 322 | 578 | 13.43 | 159.95 | A0 |
| 4022750 | 27-Feb-2004 | 08:21:24 | 08:22:06 | 08:23:20 | 116 | 1 | 252 | 6-12 | 504 | 333 | 604 | 14.25 | 161.15 | A0 |
| 4022751 | 27-Feb-2004 | 08:24:56 | 08:25:50 | 08:27:44 | 168 | 1 | 359 | 6-12 | 488 | 319 | 583 | 13.27 | 159.80 | A0 |
| 4022715 | 27-Feb-2004 | 08:38:44 | 08:49:46 | 08:58:28 | 1184 | 216 | 234503 | 12-25 | 487 | 331 | 589 | 14.04 | 159.62 | a0 A1 |
| 4022752 | 27-Feb-2004 | 09:55:44 | 09:55:50 | 10:01:40 | 356 | 38 | 36984 | 6-12 | 513 | 332 | 611 | 14.23 | 160.95 | A0 DF GS P1 |
| 4022724 | 27-Feb-2004 | 11:08:28 | 11:09:50 | 11:14:24 | 356 | 52 | 60504 | 6-12 | 533 | 327 | 626 | 14.02 | 161.72 | A0 DF P1 PE |
| Date | Start | Peak | End | Classification | B [deg] | LCM [deg] |
|---|---|---|---|---|---|---|
| 27-Feb-2004 | 08:43 | 08:51 | 08:56 | C2.5 | 14 | 31 |
| 27-Feb-2004 | 09:38 | 09:42 | 09:45 | B4.3 | 14 | 33 |

