move the mouse pointer over that image.
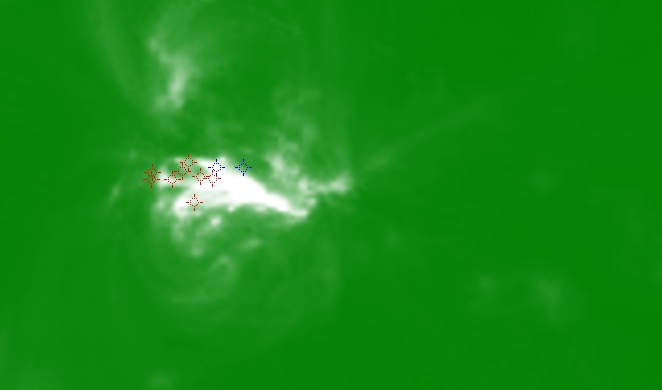
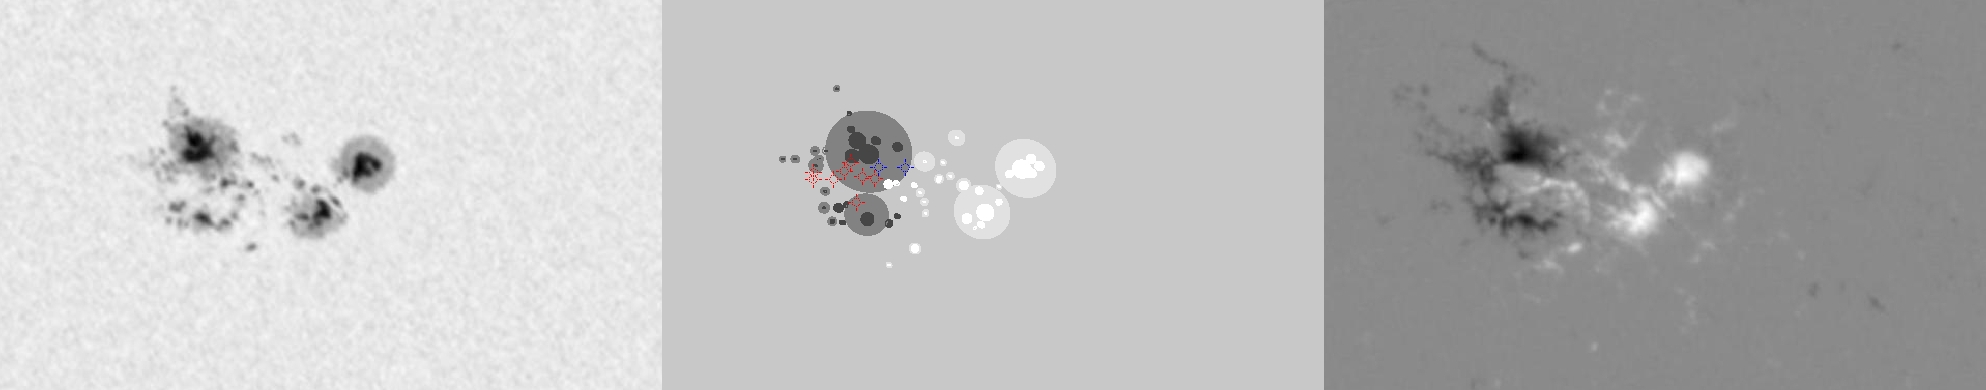
| Evolution of sunspot group NOAA 10564 and positions of flares in it animated by using the data of SOHO/MDI Debrecen Data (SDD) sunspot catalogue (lower panel, middle, ellipses with positions and areas corresponding to the relevant data of spots in SDD and with grey-scale colour coding of the magnetic polarities corresponding to that of the magnetograms), SOHO/MDI continuum images (lower panel, left) and magnetograms (lower panel, right), SOHO/EIT images (upper panel, middle), GOES and RHESSI flare data (red and blue symbols) observed within the interval around the time of SDD data. |
|
When you want to zoom in on one of the images, simply move the mouse pointer over that image. |
 |
| Year | Month | Day | Hour | Min | Sec | NOAA | Proj.U | Proj.WS | Corr.U | Corr.WS | B | L | LCM | Pos.angle | r | MU | MP |
|---|---|---|---|---|---|---|---|---|---|---|---|---|---|---|---|---|---|
| 2004 | 02 | 25 | 12 | 47 | 33 | 10564 | 316 | 1845 | 170 | 990 | 13.67 | 161.97 | 8.86 | 337.29 | 0.3888 | 7.2 | 20.1 |
| Flare | Date | Start | Peak | End | Dur [s] | Peak [c/s] | Total Counts | Energy [keV] | X pos [asec] | Y pos [asec] | Radial [asec] | B [deg] | L [deg] | Flags |
|---|---|---|---|---|---|---|---|---|---|---|---|---|---|---|
| 4022595 | 25-Feb-2004 | 11:58:36 | 12:08:06 | 12:08:56 | 620 | 1072 | 1258872 | 6-12 | 115 | 339 | 358 | 13.54 | 159.77 | A0 EE P1 |
| 4022534 | 25-Feb-2004 | 12:43:24 | 12:47:54 | 12:54:44 | 680 | 3952 | 6657720 | 6-12 | 119 | 340 | 360 | 13.61 | 159.66 | A0 ES GE P1 PE |
| 4022562 | 25-Feb-2004 | 13:10:32 | 13:10:42 | 13:22:28 | 716 | 176 | 284640 | 6-12 | 122 | 324 | 346 | 12.59 | 159.60 | A0 GS P1 |
| 4022596 | 25-Feb-2004 | 13:22:28 | 13:22:42 | 13:25:44 | 196 | 22 | 21912 | 6-12 | 122 | 349 | 370 | 14.18 | 159.54 | A0 |
| 4022565 | 25-Feb-2004 | 14:32:44 | 14:37:50 | 14:40:12 | 448 | 304 | 121920 | 6-12 | 121 | 338 | 360 | 13.48 | 158.77 | A0 P1 PE |
| 4022517 | 25-Feb-2004 | 14:40:12 | 14:41:26 | 14:43:56 | 224 | 64 | 57120 | 6-12 | 141 | 343 | 371 | 13.82 | 159.99 | A0 P1 PE |
| 4022518 | 25-Feb-2004 | 14:43:56 | 14:45:38 | 14:52:08 | 492 | 108 | 98040 | 6-12 | 136 | 338 | 364 | 13.50 | 159.63 | A0 |
| 4022567 | 25-Feb-2004 | 14:52:08 | 14:53:46 | 14:56:48 | 280 | 28 | 29880 | 6-12 | 126 | 342 | 365 | 13.74 | 158.94 | A0 DR P1 |
| Date | Start | Peak | End | Classification | B [deg] | LCM [deg] |
|---|---|---|---|---|---|---|
| 25-Feb-2004 | 12:11 | 12:25 | 12:37 | C8.0 | 14 | 08 |
| 25-Feb-2004 | 14:14 | 14:18 | 14:23 | B4.2 | 14 | 08 |

