move the mouse pointer over that image.
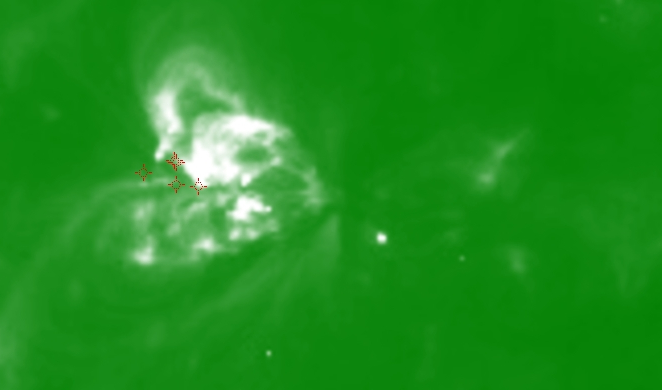
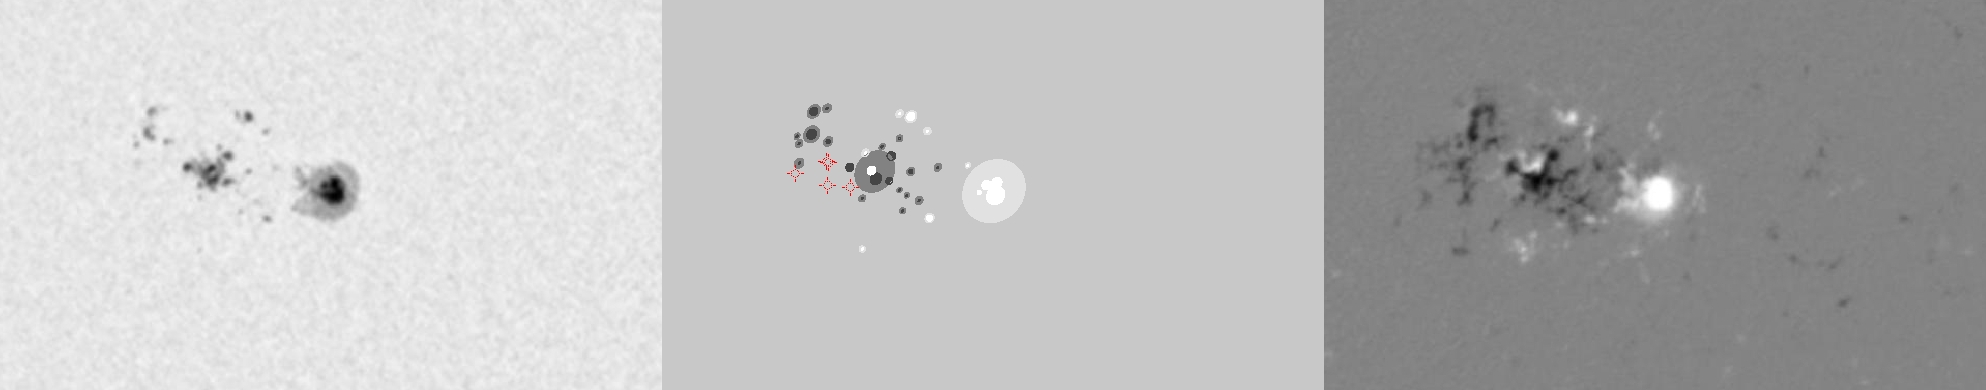
| Evolution of sunspot group NOAA 10564 and positions of flares in it animated by using the data of SOHO/MDI Debrecen Data (SDD) sunspot catalogue (lower panel, middle, ellipses with positions and areas corresponding to the relevant data of spots in SDD and with grey-scale colour coding of the magnetic polarities corresponding to that of the magnetograms), SOHO/MDI continuum images (lower panel, left) and magnetograms (lower panel, right), SOHO/EIT images (upper panel, middle), GOES and RHESSI flare data (red and blue symbols) observed within the interval around the time of SDD data. |
|
When you want to zoom in on one of the images, simply move the mouse pointer over that image. |
 |
| Year | Month | Day | Hour | Min | Sec | NOAA | Proj.U | Proj.WS | Corr.U | Corr.WS | B | L | LCM | Pos.angle | r | MU | MP |
|---|---|---|---|---|---|---|---|---|---|---|---|---|---|---|---|---|---|
| 2004 | 02 | 22 | 22 | 23 | 32 | 10564 | 132 | 763 | 75 | 448 | 13.78 | 163.13 | -24.21 | 48.82 | 0.5293 | 395.9 | 153.7 |
| Flare | Date | Start | Peak | End | Dur [s] | Peak [c/s] | Total Counts | Energy [keV] | X pos [asec] | Y pos [asec] | Radial [asec] | B [deg] | L [deg] | Flags |
|---|---|---|---|---|---|---|---|---|---|---|---|---|---|---|
| 4022260 | 22-Feb-2004 | 21:34:36 | 21:37:06 | 21:39:36 | 300 | 60 | 74832 | 6-12 | -448 | 342 | 564 | 14.66 | 158.27 | A0 DR P1 |
| 4022261 | 22-Feb-2004 | 21:39:36 | 21:42:18 | 21:42:52 | 196 | 64 | 47232 | 6-12 | -448 | 343 | 564 | 14.72 | 158.21 | A0 DR P1 |
| 4022287 | 22-Feb-2004 | 22:25:52 | 22:29:02 | 22:35:52 | 600 | 84 | 150480 | 6-12 | -435 | 329 | 546 | 13.76 | 158.82 | A0 DR P1 |
| 4022264 | 22-Feb-2004 | 22:39:36 | 22:44:06 | 22:47:12 | 456 | 56 | 100728 | 6-12 | -417 | 328 | 530 | 13.63 | 159.94 | A0 |
| 4022288 | 22-Feb-2004 | 22:47:12 | 22:58:54 | 23:06:32 | 1160 | 432 | 946512 | 12-25 | -448 | 337 | 561 | 14.33 | 157.57 | A0 DR P1 |
| Date | Start | Peak | End | Classification | B [deg] | LCM [deg] |
|---|---|---|---|---|---|---|
| No data |

