
move the mouse pointer over that image.
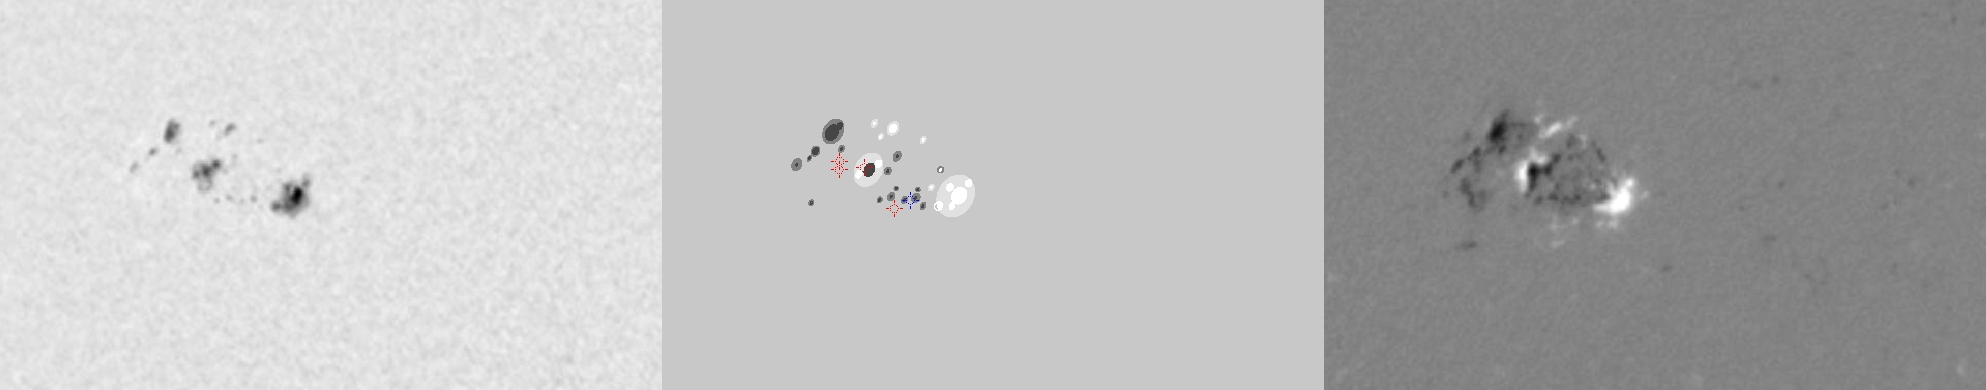
| Evolution of sunspot group NOAA 10564 and positions of flares in it animated by using the data of SOHO/MDI Debrecen Data (SDD) sunspot catalogue (lower panel, middle, ellipses with positions and areas corresponding to the relevant data of spots in SDD and with grey-scale colour coding of the magnetic polarities corresponding to that of the magnetograms), SOHO/MDI continuum images (lower panel, left) and magnetograms (lower panel, right), SOHO/EIT images (upper panel, middle), GOES and RHESSI flare data (red and blue symbols) observed within the interval around the time of SDD data. |
|
When you want to zoom in on one of the images, simply move the mouse pointer over that image. |
 |
| Year | Month | Day | Hour | Min | Sec | NOAA | Proj.U | Proj.WS | Corr.U | Corr.WS | B | L | LCM | Pos.angle | r | MU | MP |
|---|---|---|---|---|---|---|---|---|---|---|---|---|---|---|---|---|---|
| 2004 | 02 | 22 | 04 | 47 | 32 | 10564 | 106 | 422 | 71 | 279 | 14.06 | 161.41 | -35.58 | 59.00 | 0.6598 | 275.7 | 115.0 |
| Flare | Date | Start | Peak | End | Dur [s] | Peak [c/s] | Total Counts | Energy [keV] | X pos [asec] | Y pos [asec] | Radial [asec] | B [deg] | L [deg] | Flags |
|---|---|---|---|---|---|---|---|---|---|---|---|---|---|---|
| 4022204 | 22-Feb-2004 | 03:55:48 | 03:59:38 | 04:06:28 | 640 | 4336 | 3144048 | 12-25 | -544 | 304 | 623 | 12.72 | 161.28 | A0 DR P1 |
| 4022228 | 22-Feb-2004 | 04:56:40 | 04:59:10 | 05:00:44 | 244 | 28 | 24648 | 6-12 | -564 | 335 | 656 | 14.83 | 158.83 | A0 DR GS P1 |
| 4022271 | 22-Feb-2004 | 05:00:44 | 05:01:14 | 05:06:00 | 316 | 24 | 28728 | 6-12 | -548 | 331 | 641 | 14.47 | 160.11 | A0 DR P1 |
| 4022229 | 22-Feb-2004 | 05:06:00 | 05:08:10 | 05:12:20 | 380 | 40 | 37752 | 6-12 | -562 | 330 | 652 | 14.49 | 158.96 | A0 |
| Date | Start | Peak | End | Classification | B [deg] | LCM [deg] |
|---|---|---|---|---|---|---|
| 22-Feb-2004 | 03:54 | 04:00 | 04:03 | C1.1 | 13 | -35 |

