move the mouse pointer over that image.
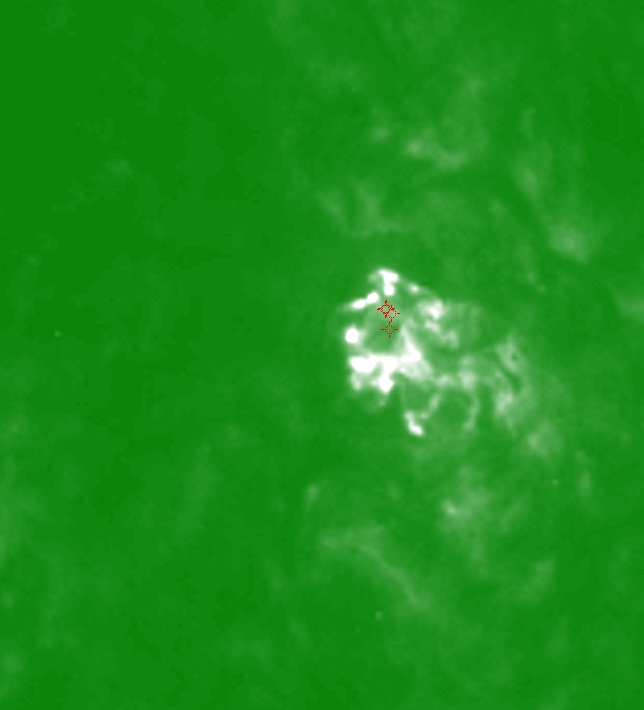
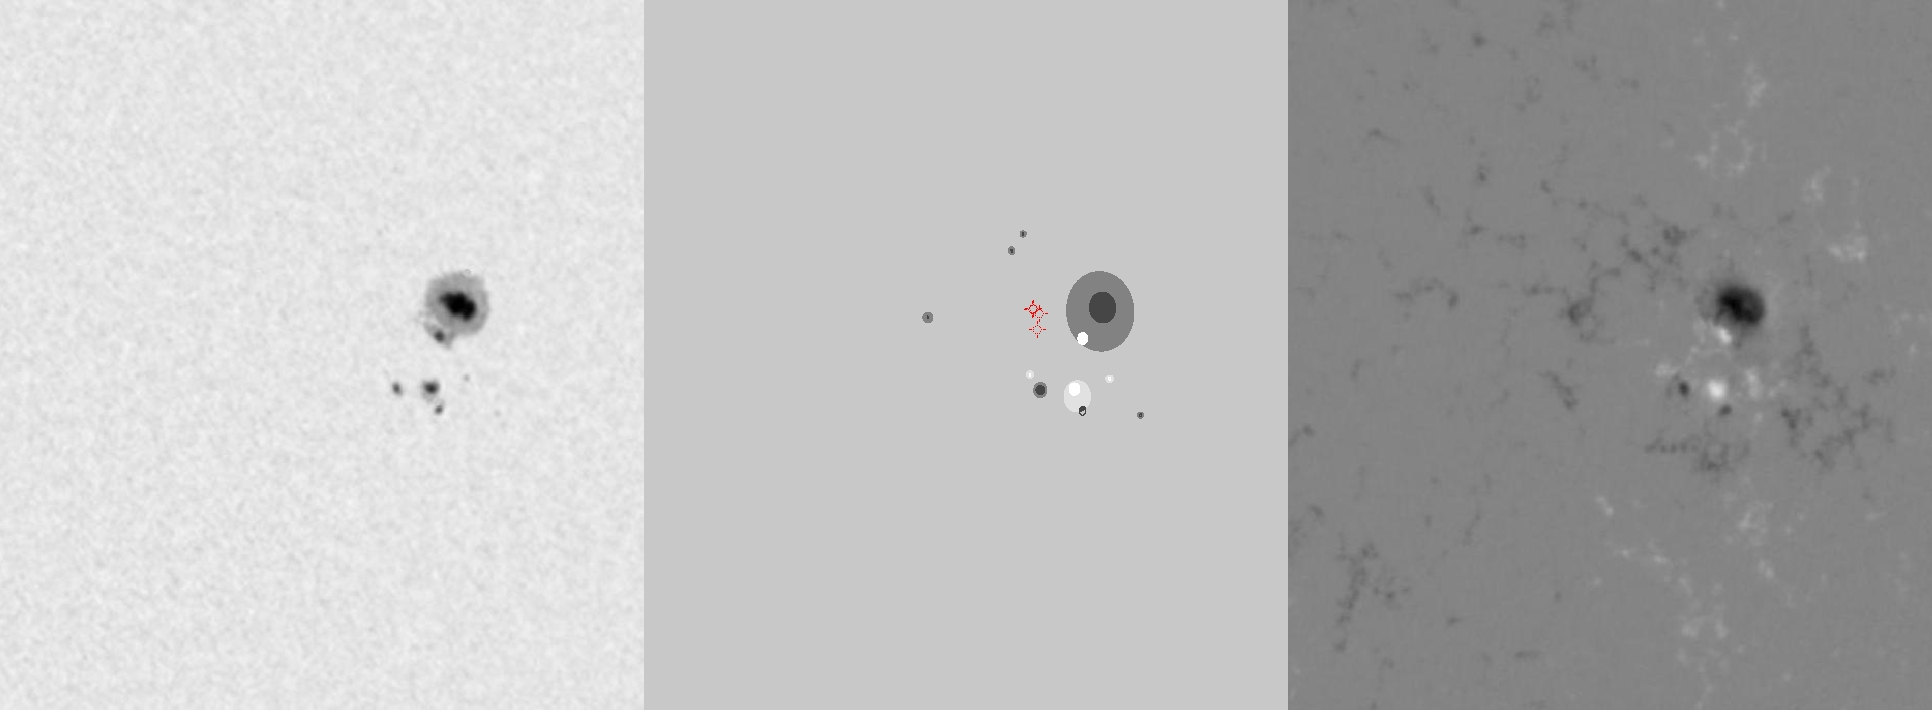
| Evolution of sunspot group NOAA 10501 and positions of flares in it animated by using the data of SOHO/MDI Debrecen Data (SDD) sunspot catalogue (lower panel, middle, ellipses with positions and areas corresponding to the relevant data of spots in SDD and with grey-scale colour coding of the magnetic polarities corresponding to that of the magnetograms), SOHO/MDI continuum images (lower panel, left) and magnetograms (lower panel, right), SOHO/EIT images (upper panel, middle), GOES and RHESSI flare data (red and blue symbols) observed within the interval around the time of SDD data. |
|
When you want to zoom in on one of the images, simply move the mouse pointer over that image. |
 |
| Year | Month | Day | Hour | Min | Sec | NOAA | Proj.U | Proj.WS | Corr.U | Corr.WS | B | L | LCM | Pos.angle | r | MU | MP |
|---|---|---|---|---|---|---|---|---|---|---|---|---|---|---|---|---|---|
| 2003 | 11 | 22 | 01 | 35 | 32 | 10501 | 125 | 711 | 73 | 417 | 3.72 | 3.64 | 32.64 | 273.73 | 0.5419 | -1033.7 | -386.3 |
| Flare | Date | Start | Peak | End | Dur [s] | Peak [c/s] | Total Counts | Energy [keV] | X pos [asec] | Y pos [asec] | Radial [asec] | B [deg] | L [deg] | Flags |
|---|---|---|---|---|---|---|---|---|---|---|---|---|---|---|
| 3112204 | 22-Nov-2003 | 01:36:20 | 01:38:18 | 01:41:40 | 320 | 200 | 126264 | 12-25 | 505 | 38 | 506 | 4.11 | 361.48 | A0 DF P1 |
| 3112205 | 22-Nov-2003 | 01:43:24 | 01:51:46 | 01:57:24 | 840 | 400 | 668160 | 12-25 | 505 | 41 | 507 | 4.29 | 361.37 | A0 DF P1 |
| 31122112 | 22-Nov-2003 | 01:57:24 | 02:02:22 | 02:08:24 | 660 | 68 | 97656 | 6-12 | 510 | 28 | 511 | 3.51 | 361.59 | A0 DF P1 PE |
| 3112241 | 22-Nov-2003 | 02:12:08 | 02:13:02 | 02:17:04 | 296 | 68 | 36216 | 6-12 | 510 | 41 | 512 | 4.28 | 361.52 | A0 DF DR P1 |
| Date | Start | Peak | End | Classification | B [deg] | LCM [deg] |
|---|---|---|---|---|---|---|
| No data |

