move the mouse pointer over that image.
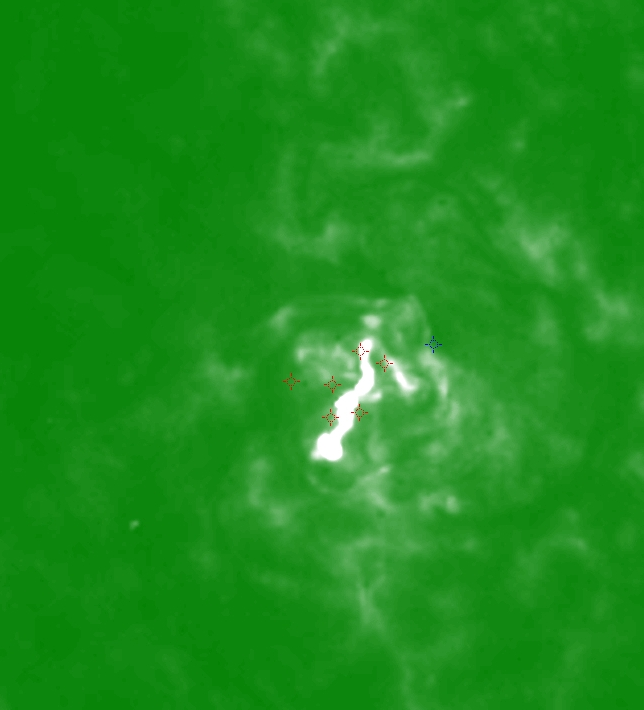
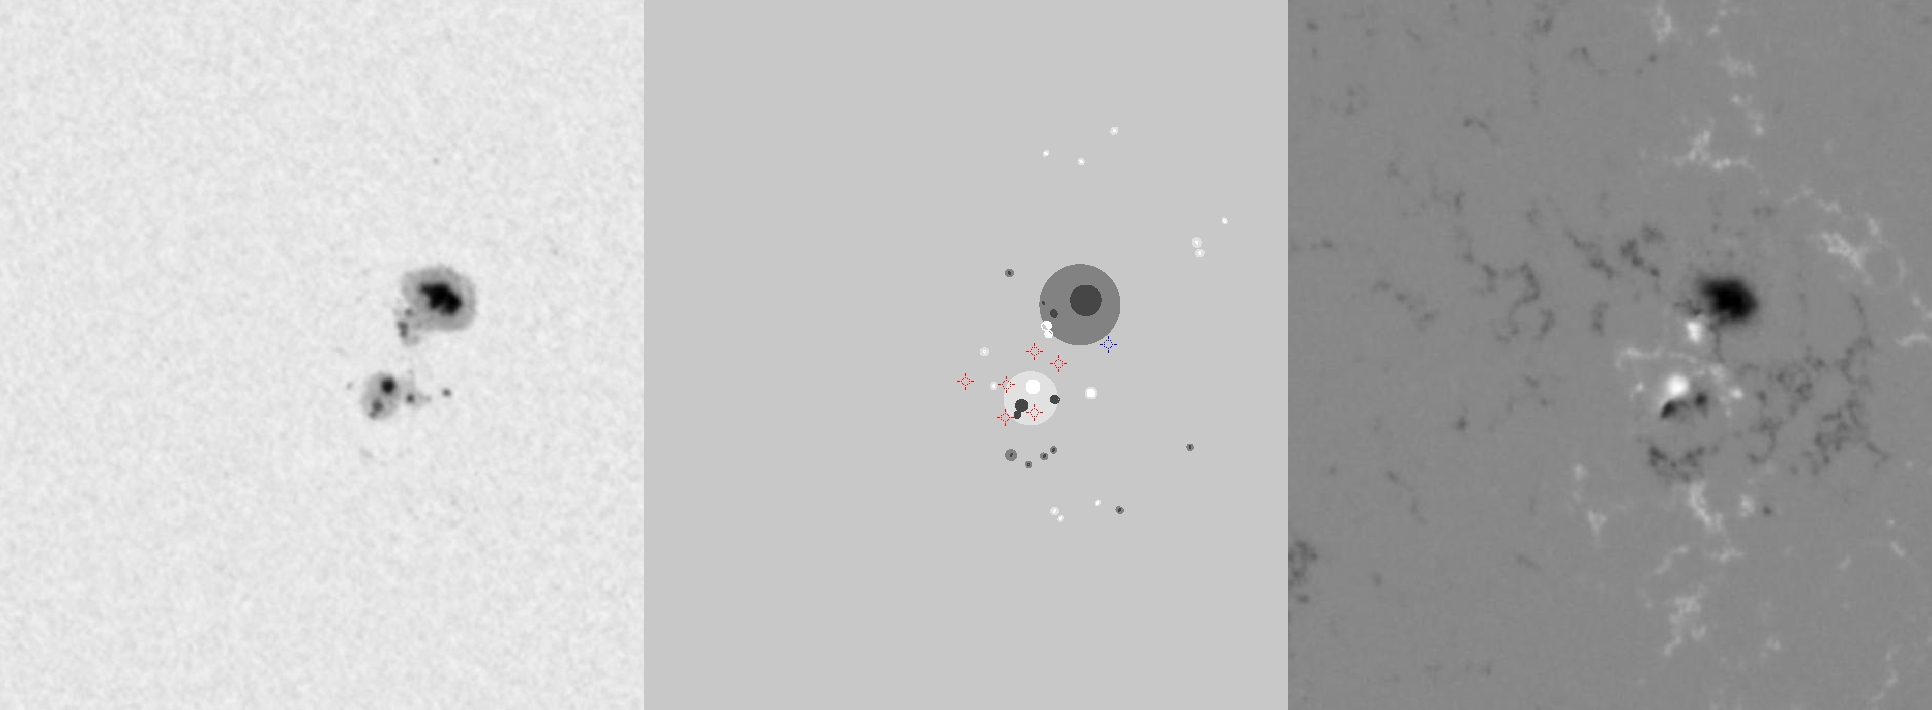
| Evolution of sunspot group NOAA 10501 and positions of flares in it animated by using the data of SOHO/MDI Debrecen Data (SDD) sunspot catalogue (lower panel, middle, ellipses with positions and areas corresponding to the relevant data of spots in SDD and with grey-scale colour coding of the magnetic polarities corresponding to that of the magnetograms), SOHO/MDI continuum images (lower panel, left) and magnetograms (lower panel, right), SOHO/EIT images (upper panel, middle), GOES and RHESSI flare data (red and blue symbols) observed within the interval around the time of SDD data. |
|
When you want to zoom in on one of the images, simply move the mouse pointer over that image. |
 |
| Year | Month | Day | Hour | Min | Sec | NOAA | Proj.U | Proj.WS | Corr.U | Corr.WS | B | L | LCM | Pos.angle | r | MU | MP |
|---|---|---|---|---|---|---|---|---|---|---|---|---|---|---|---|---|---|
| 2003 | 11 | 20 | 03 | 26 | 32 | 10501 | 171 | 1095 | 85 | 546 | 3.32 | 3.42 | 7.07 | 276.69 | 0.1297 | -1040.6 | -324.7 |
| Flare | Date | Start | Peak | End | Dur [s] | Peak [c/s] | Total Counts | Energy [keV] | X pos [asec] | Y pos [asec] | Radial [asec] | B [deg] | L [deg] | Flags |
|---|---|---|---|---|---|---|---|---|---|---|---|---|---|---|
| 3112003 | 20-Nov-2003 | 00:28:00 | 00:31:10 | 00:36:20 | 500 | 314 | 292963 | 6-12 | 66 | -33 | 74 | .45 | 360.66 | A0 DF DR P1 |
| 31120138 | 20-Nov-2003 | 00:38:20 | 00:39:02 | 00:39:36 | 76 | 26 | 9456 | 6-12 | 50 | -36 | 62 | .28 | 359.63 | A0 DF P1 |
| 3112007 | 20-Nov-2003 | 01:35:24 | 01:49:06 | 01:49:52 | 868 | 2160 | 4476946 | 12-25 | 105 | -2 | 105 | 2.28 | 362.28 | A0 a1 DF P1 |
| 31120139 | 20-Nov-2003 | 01:50:52 | 01:59:38 | 02:22:16 | 1884 | 976 | 5673979 | 25-50 | 93 | 6 | 93 | 2.76 | 361.47 | a0 A1 DF DR P1 PE |
| 31120140 | 20-Nov-2003 | 03:03:24 | 03:03:34 | 03:03:40 | 16 | 136 | 11904 | 6-12 | 95 | -15 | 96 | 1.51 | 361.00 | A0 DF P1 PE |
| 31120141 | 20-Nov-2003 | 03:11:04 | 03:12:30 | 03:14:04 | 180 | 120 | 78960 | 6-12 | 72 | -13 | 73 | 1.63 | 359.54 | A0 DF P1 |
| Date | Start | Peak | End | Classification | B [deg] | LCM [deg] |
|---|---|---|---|---|---|---|
| 20-Nov-2003 | 01:47 | 02:12 | 02:28 | M1.4 | 03 | 08 |

