move the mouse pointer over that image.
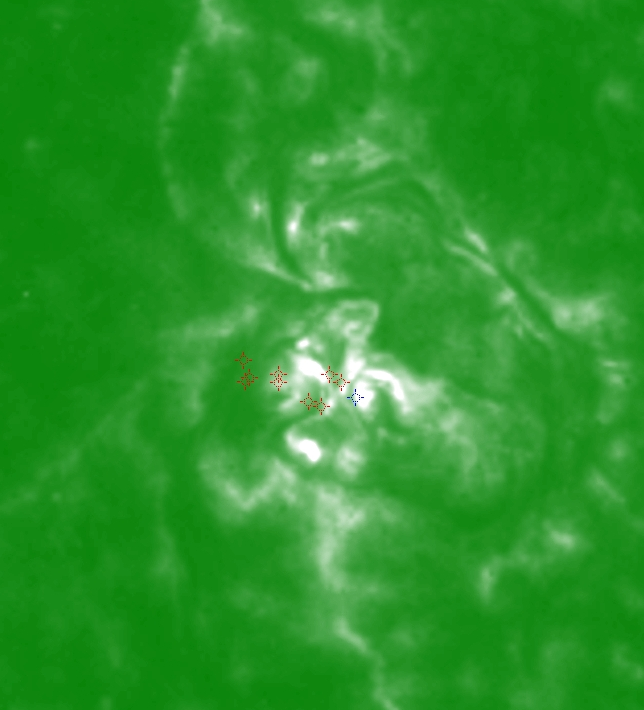
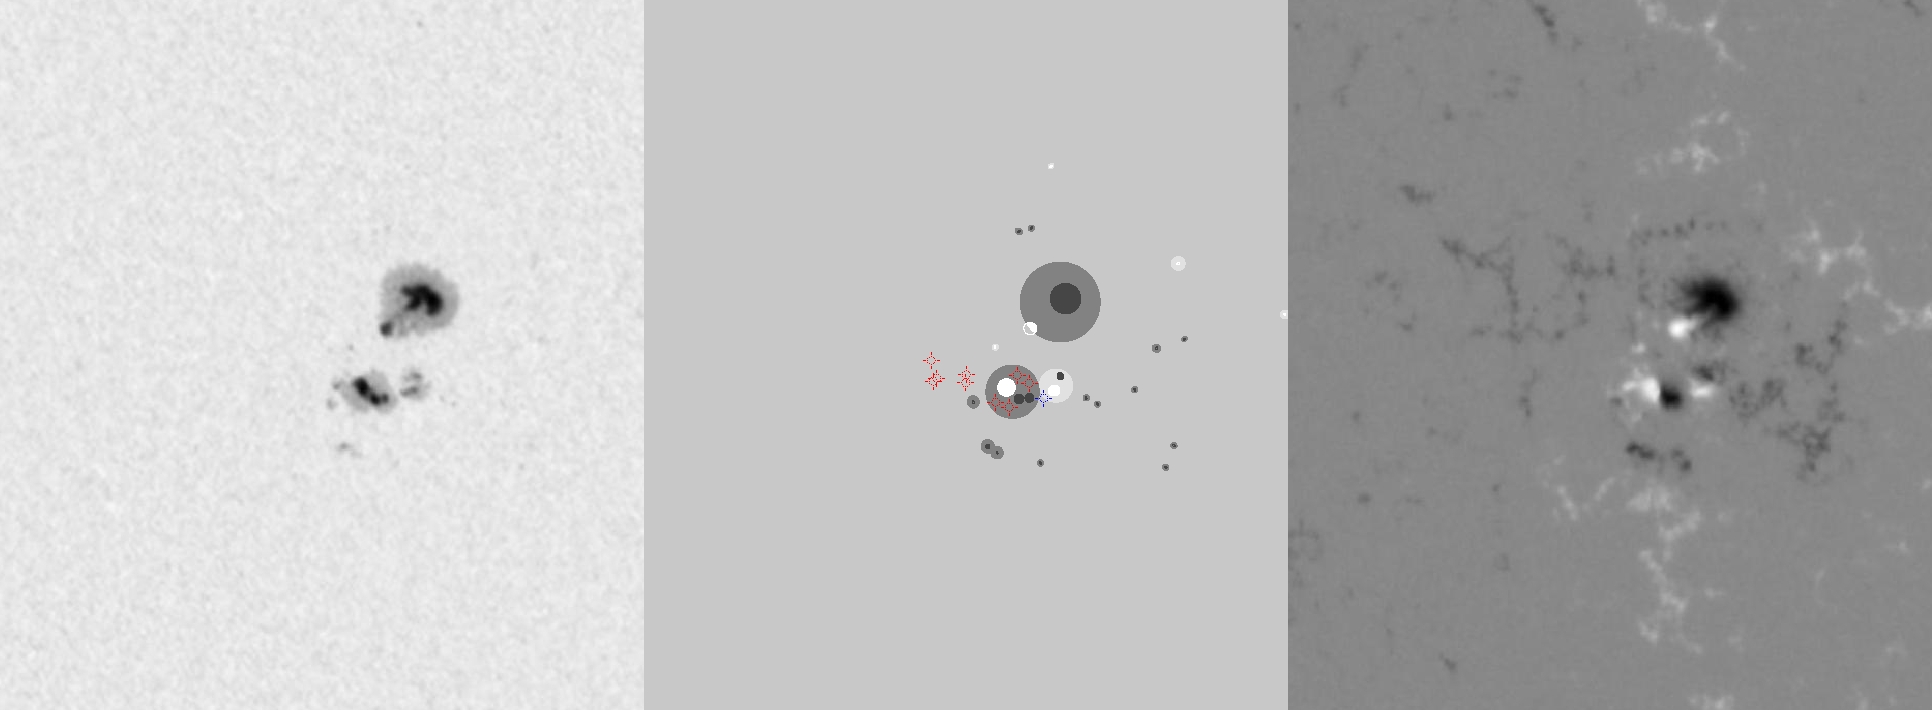
| Evolution of sunspot group NOAA 10501 and positions of flares in it animated by using the data of SOHO/MDI Debrecen Data (SDD) sunspot catalogue (lower panel, middle, ellipses with positions and areas corresponding to the relevant data of spots in SDD and with grey-scale colour coding of the magnetic polarities corresponding to that of the magnetograms), SOHO/MDI continuum images (lower panel, left) and magnetograms (lower panel, right), SOHO/EIT images (upper panel, middle), GOES and RHESSI flare data (red and blue symbols) observed within the interval around the time of SDD data. |
|
When you want to zoom in on one of the images, simply move the mouse pointer over that image. |
 |
| Year | Month | Day | Hour | Min | Sec | NOAA | Proj.U | Proj.WS | Corr.U | Corr.WS | B | L | LCM | Pos.angle | r | MU | MP |
|---|---|---|---|---|---|---|---|---|---|---|---|---|---|---|---|---|---|
| 2003 | 11 | 19 | 04 | 22 | 32 | 10501 | 184 | 1224 | 91 | 611 | 3.18 | 3.46 | -5.56 | 81.51 | 0.0979 | -832.1 | -336.1 |
| Flare | Date | Start | Peak | End | Dur [s] | Peak [c/s] | Total Counts | Energy [keV] | X pos [asec] | Y pos [asec] | Radial [asec] | B [deg] | L [deg] | Flags |
|---|---|---|---|---|---|---|---|---|---|---|---|---|---|---|
| 3111982 | 19-Nov-2003 | 01:50:48 | 01:51:58 | 01:54:16 | 208 | 41 | 28025 | 6-12 | -139 | -11 | 140 | 1.85 | .87 | A0 DF P1 |
| 3111987 | 19-Nov-2003 | 03:07:32 | 03:08:46 | 03:12:32 | 300 | 4 | 5211 | 6-12 | -121 | -31 | 125 | .66 | 1.25 | A0 DF P1 |
| 31119123 | 19-Nov-2003 | 03:45:28 | 03:46:46 | 03:49:04 | 216 | 4 | 3665 | 6-12 | -118 | -28 | 121 | .84 | 1.09 | A0 DF DR P1 |
| 3111905 | 19-Nov-2003 | 03:50:04 | 04:00:06 | 04:01:56 | 712 | 1968 | 1103448 | 50-100 | -93 | -16 | 94 | 1.56 | 2.46 | a0 A1 DF DR EE P1 |
| 3111988 | 19-Nov-2003 | 05:09:48 | 05:11:42 | 05:13:20 | 212 | 3 | 2714 | 6-12 | -111 | -11 | 112 | 1.85 | .73 | A0 DF P1 |
| 3111961 | 19-Nov-2003 | 05:17:52 | 05:18:26 | 05:19:24 | 92 | 4 | 1265 | 6-12 | -109 | -16 | 110 | 1.55 | .78 | A0 DF P1 |
| 3111990 | 19-Nov-2003 | 06:37:16 | 06:39:26 | 06:41:36 | 260 | 48 | 55824 | 6-12 | -105 | -15 | 106 | 1.60 | .28 | A0 DF P1 |
| 31119126 | 19-Nov-2003 | 06:41:36 | 06:43:46 | 06:45:28 | 232 | 72 | 61056 | 6-12 | -105 | -2 | 105 | 2.38 | .24 | A0 DF P1 |
| 3111993 | 19-Nov-2003 | 06:57:28 | 06:58:18 | 06:59:36 | 128 | 40 | 22464 | 6-12 | -97 | -13 | 98 | 1.72 | .59 | A0 DF P1 |
| Date | Start | Peak | End | Classification | B [deg] | LCM [deg] |
|---|---|---|---|---|---|---|
| 19-Nov-2003 | 03:55 | 04:01 | 04:06 | M1.7 | 01 | -06 |

