move the mouse pointer over that image.
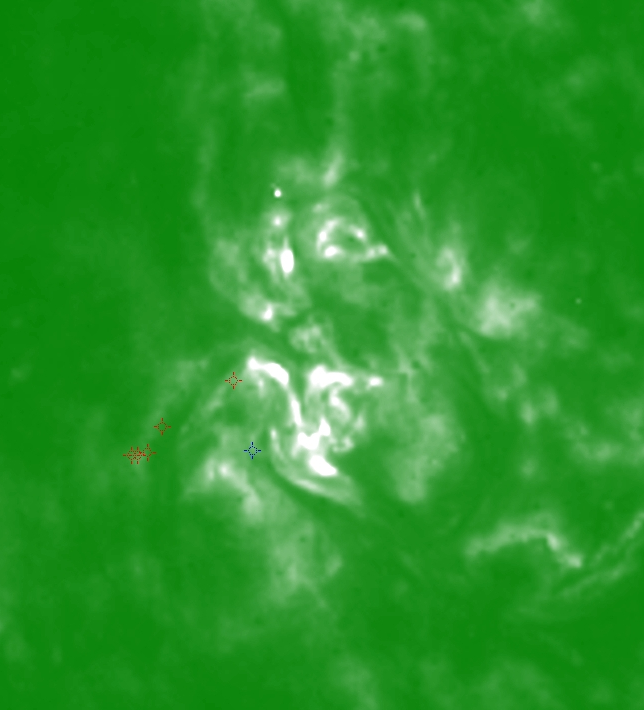
| Evolution of sunspot group NOAA 10501 and positions of flares in it animated by using the data of SOHO/MDI Debrecen Data (SDD) sunspot catalogue (lower panel, middle, ellipses with positions and areas corresponding to the relevant data of spots in SDD and with grey-scale colour coding of the magnetic polarities corresponding to that of the magnetograms), SOHO/MDI continuum images (lower panel, left) and magnetograms (lower panel, right), SOHO/EIT images (upper panel, middle), GOES and RHESSI flare data (red and blue symbols) observed within the interval around the time of SDD data. |
|
When you want to zoom in on one of the images, simply move the mouse pointer over that image. |
 |
| Year | Month | Day | Hour | Min | Sec | NOAA | Proj.U | Proj.WS | Corr.U | Corr.WS | B | L | LCM | Pos.angle | r | MU | MP |
|---|---|---|---|---|---|---|---|---|---|---|---|---|---|---|---|---|---|
| 2003 | 11 | 17 | 09 | 35 | 32 | 10501 | 187 | 1105 | 107 | 630 | 3.12 | 2.78 | -29.73 | 88.14 | 0.4982 | -557.3 | -368.4 |
| Flare | Date | Start | Peak | End | Dur [s] | Peak [c/s] | Total Counts | Energy [keV] | X pos [asec] | Y pos [asec] | Radial [asec] | B [deg] | L [deg] | Flags |
|---|---|---|---|---|---|---|---|---|---|---|---|---|---|---|
| 3111705 | 17-Nov-2003 | 09:13:16 | 09:14:02 | 09:17:40 | 264 | 1406 | 1393186 | 12-25 | -521 | -12 | 521 | 1.59 | -1.29 | A0 a1 DF ES GE P1 PE |
| 3111748 | 17-Nov-2003 | 09:37:28 | 09:37:34 | 10:02:40 | 1512 | 224 | 981124 | 12-25 | -561 | -41 | 563 | -.22 | -4.37 | a0 A1 DF GS P1 |
| 3111778 | 17-Nov-2003 | 10:02:40 | 10:03:54 | 10:06:56 | 256 | 59 | 77757 | 12-25 | -564 | -57 | 567 | -1.18 | -4.84 | A0 a1 DF P1 |
| 3111749 | 17-Nov-2003 | 10:06:56 | 10:08:02 | 10:16:08 | 552 | 56 | 142116 | 12-25 | -573 | -59 | 576 | -1.32 | -5.55 | a0 A1 DF P1 |
| 3111779 | 17-Nov-2003 | 10:16:08 | 10:17:50 | 10:20:04 | 236 | 46 | 51069 | 12-25 | -567 | -59 | 571 | -1.31 | -5.19 | A0 a1 DF P1 |
| Date | Start | Peak | End | Classification | B [deg] | LCM [deg] |
|---|---|---|---|---|---|---|
| 17-Nov-2003 | 08:55 | 09:05 | 09:19 | M4.2 | -01 | -33 |

