move the mouse pointer over that image.
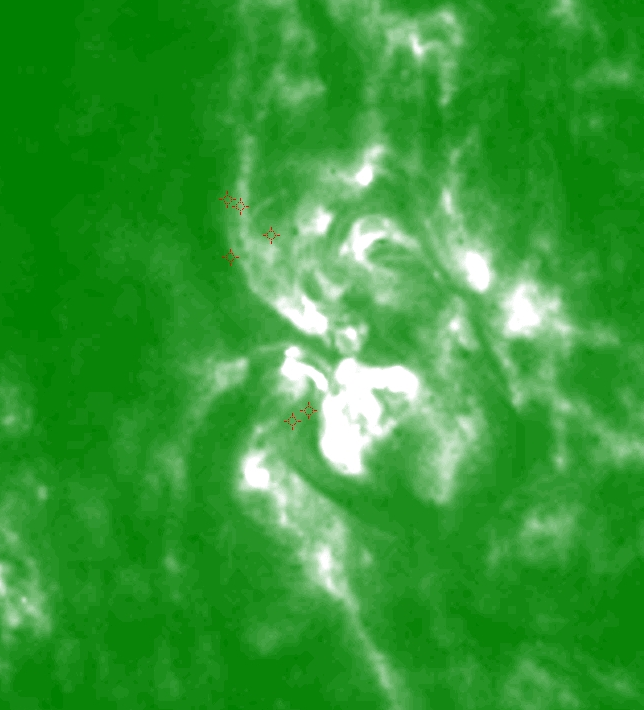
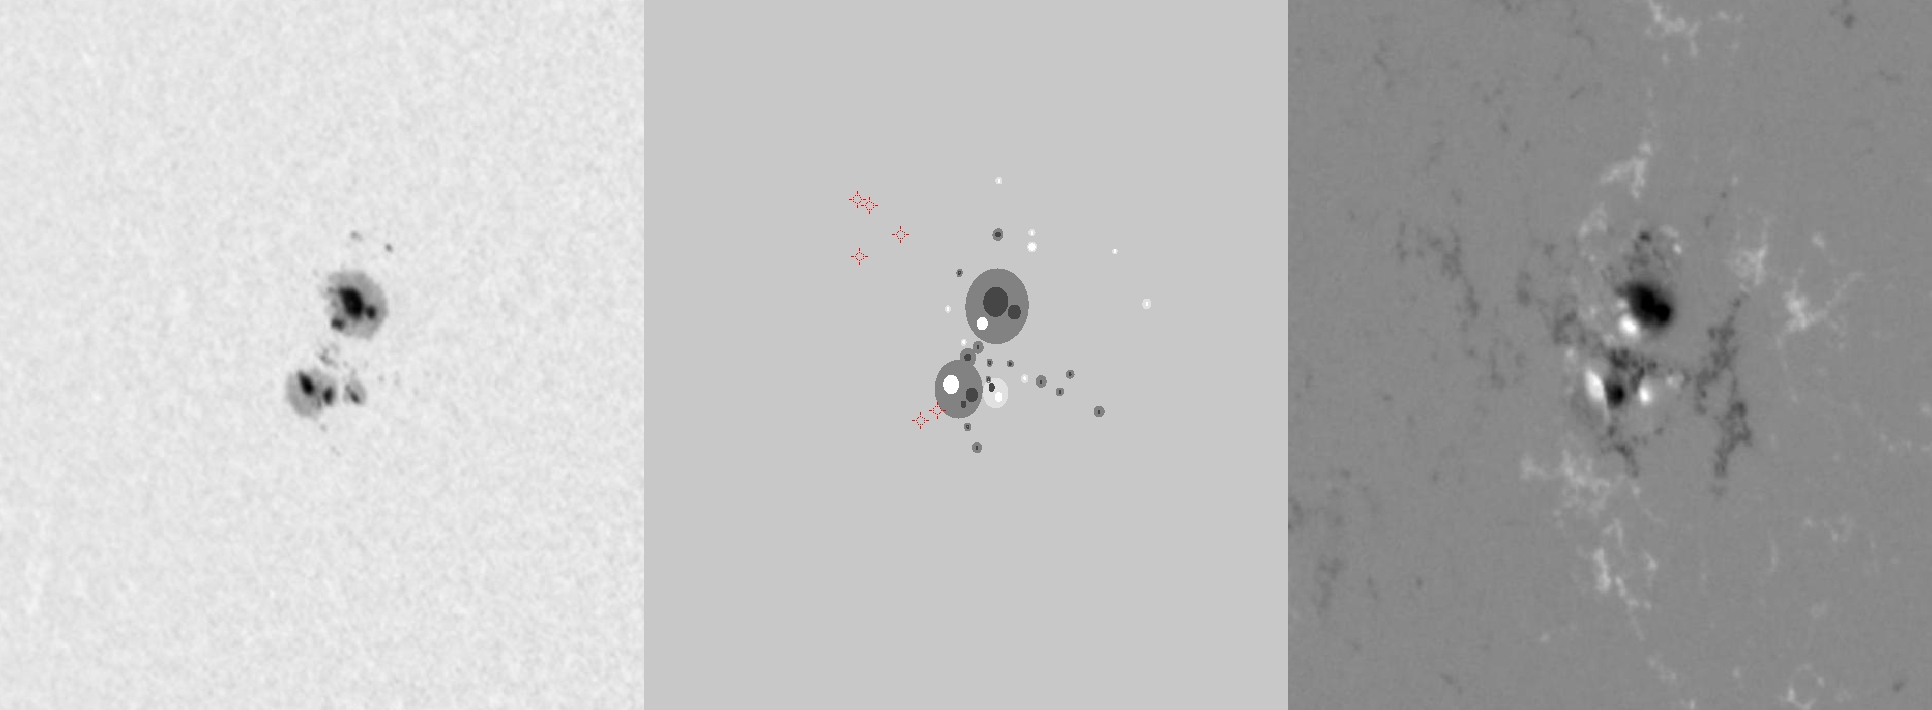
| Evolution of sunspot group NOAA 10501 and positions of flares in it animated by using the data of SOHO/MDI Debrecen Data (SDD) sunspot catalogue (lower panel, middle, ellipses with positions and areas corresponding to the relevant data of spots in SDD and with grey-scale colour coding of the magnetic polarities corresponding to that of the magnetograms), SOHO/MDI continuum images (lower panel, left) and magnetograms (lower panel, right), SOHO/EIT images (upper panel, middle), GOES and RHESSI flare data (red and blue symbols) observed within the interval around the time of SDD data. |
|
When you want to zoom in on one of the images, simply move the mouse pointer over that image. |
 |
| Year | Month | Day | Hour | Min | Sec | NOAA | Proj.U | Proj.WS | Corr.U | Corr.WS | B | L | LCM | Pos.angle | r | MU | MP |
|---|---|---|---|---|---|---|---|---|---|---|---|---|---|---|---|---|---|
| 2003 | 11 | 16 | 23 | 59 | 32 | 10501 | 170 | 1010 | 102 | 607 | 3.13 | 3.08 | -34.70 | 88.25 | 0.5714 | -682.7 | -325.3 |
| Flare | Date | Start | Peak | End | Dur [s] | Peak [c/s] | Total Counts | Energy [keV] | X pos [asec] | Y pos [asec] | Radial [asec] | B [deg] | L [deg] | Flags |
|---|---|---|---|---|---|---|---|---|---|---|---|---|---|---|
| 3111677 | 16-Nov-2003 | 22:23:12 | 22:25:02 | 22:30:00 | 408 | 48 | 47640 | 6-12 | -587 | -28 | 588 | .54 | -.15 | A0 |
| 3111618 | 16-Nov-2003 | 22:50:40 | 22:57:34 | 23:07:24 | 1004 | 240 | 840528 | 12-25 | -602 | 82 | 608 | 7.05 | -1.94 | A0 DR P1 PE |
| 3111619 | 16-Nov-2003 | 23:39:20 | 23:42:26 | 23:45:00 | 340 | 496 | 852864 | 6-12 | -611 | 100 | 620 | 8.10 | -3.16 | A0 DR GS P1 PE |
| 3111643 | 16-Nov-2003 | 23:45:00 | 23:46:14 | 23:51:52 | 412 | 464 | 776064 | 6-12 | -618 | 104 | 627 | 8.32 | -3.78 | A0 DR P1 |
| 3111771 | 17-Nov-2003 | 01:41:08 | 01:42:10 | 02:09:00 | 1672 | 95 | 138111 | 12-25 | -549 | -36 | 551 | .13 | .86 | A0 a1 DR P1 PE |
| 3111742 | 17-Nov-2003 | 03:42:12 | 03:47:30 | 03:55:08 | 776 | 80 | 207504 | 6-12 | -559 | 66 | 563 | 6.18 | -1.26 | A0 DR P1 |
| Date | Start | Peak | End | Classification | B [deg] | LCM [deg] |
|---|---|---|---|---|---|---|
| No data |

