move the mouse pointer over that image.
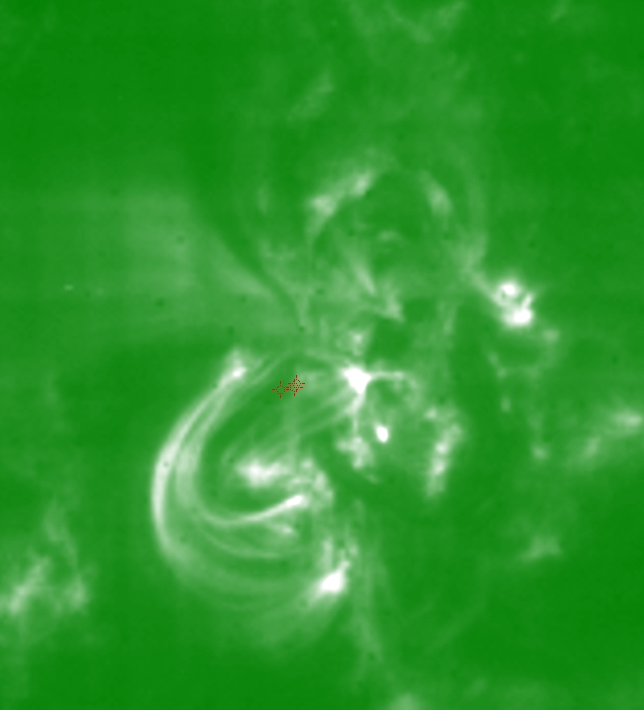
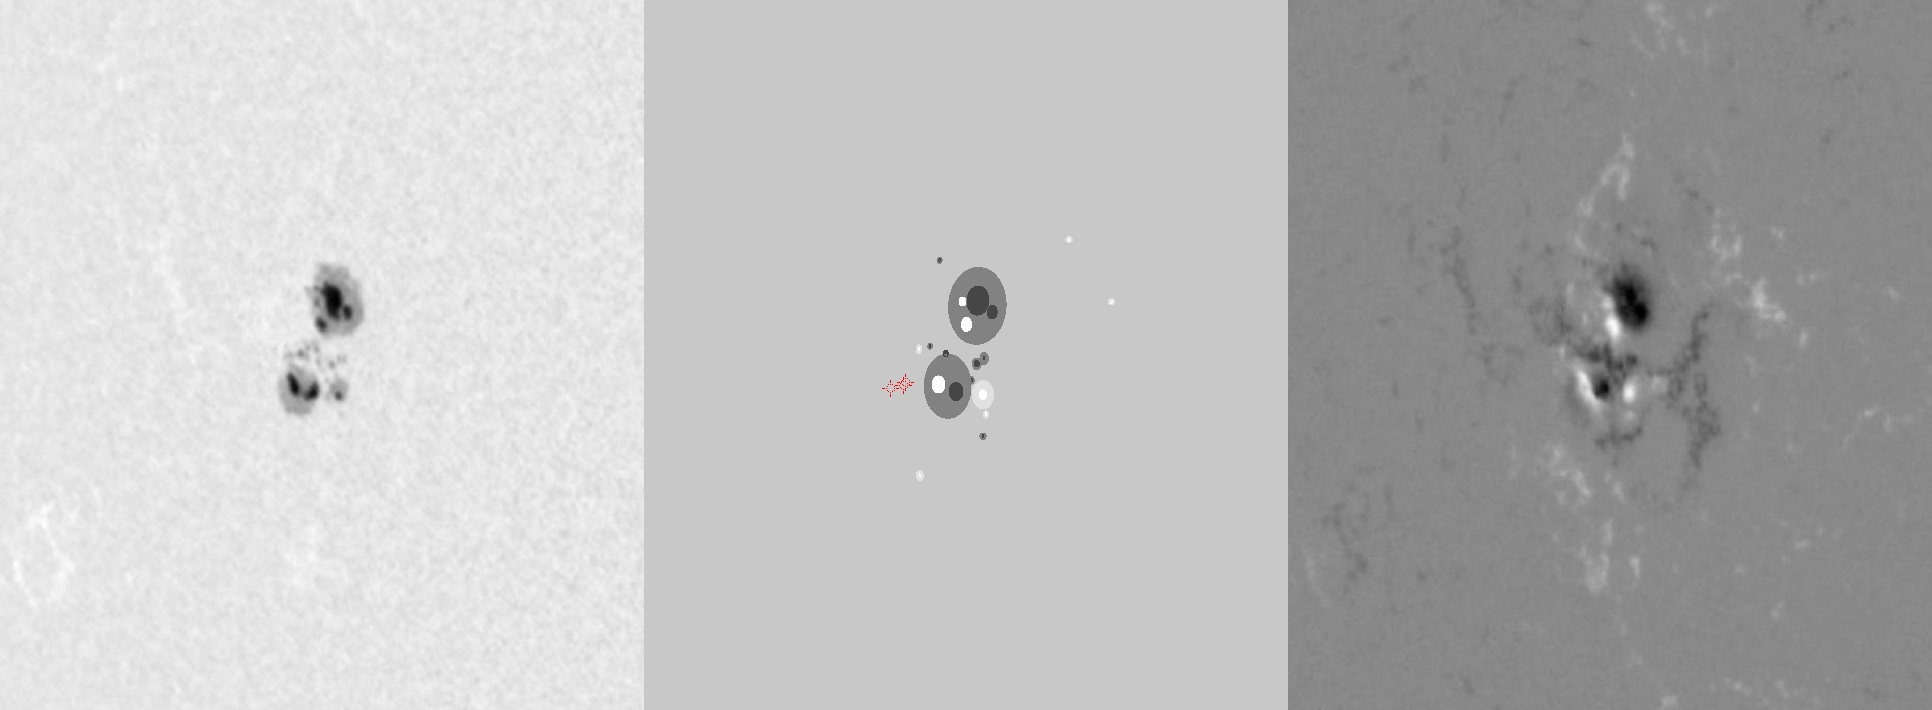
| Evolution of sunspot group NOAA 10501 and positions of flares in it animated by using the data of SOHO/MDI Debrecen Data (SDD) sunspot catalogue (lower panel, middle, ellipses with positions and areas corresponding to the relevant data of spots in SDD and with grey-scale colour coding of the magnetic polarities corresponding to that of the magnetograms), SOHO/MDI continuum images (lower panel, left) and magnetograms (lower panel, right), SOHO/EIT images (upper panel, middle), GOES and RHESSI flare data (red and blue symbols) observed within the interval around the time of SDD data. |
|
When you want to zoom in on one of the images, simply move the mouse pointer over that image. |
 |
| Year | Month | Day | Hour | Min | Sec | NOAA | Proj.U | Proj.WS | Corr.U | Corr.WS | B | L | LCM | Pos.angle | r | MU | MP |
|---|---|---|---|---|---|---|---|---|---|---|---|---|---|---|---|---|---|
| 2003 | 11 | 16 | 09 | 35 | 32 | 10501 | 162 | 905 | 109 | 611 | 3.04 | 2.78 | -42.91 | 88.40 | 0.6828 | -511.4 | -284.1 |
| Flare | Date | Start | Peak | End | Dur [s] | Peak [c/s] | Total Counts | Energy [keV] | X pos [asec] | Y pos [asec] | Radial [asec] | B [deg] | L [deg] | Flags |
|---|---|---|---|---|---|---|---|---|---|---|---|---|---|---|
| 3111682 | 16-Nov-2003 | 09:41:28 | 09:46:50 | 09:54:04 | 756 | 1 | 2304 | 6-12 | -677 | -8 | 677 | 1.55 | -.37 | A0 DF P1 |
| 3111683 | 16-Nov-2003 | 10:01:28 | 10:02:22 | 10:02:40 | 72 | 1 | 264 | 6-12 | -675 | -10 | 675 | 1.43 | -.34 | A0 DF P1 |
| 3111637 | 16-Nov-2003 | 10:04:16 | 10:17:46 | 10:18:36 | 860 | 144 | 158095 | 25-50 | -680 | -12 | 680 | 1.30 | -.90 | a0 A1 DF EE P1 |
| Date | Start | Peak | End | Classification | B [deg] | LCM [deg] |
|---|---|---|---|---|---|---|
| No data |

