move the mouse pointer over that image.
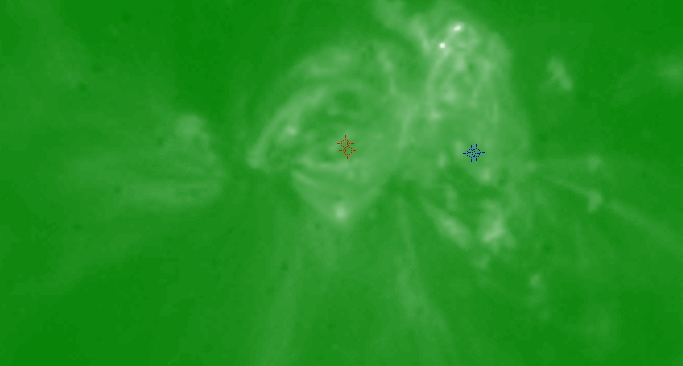
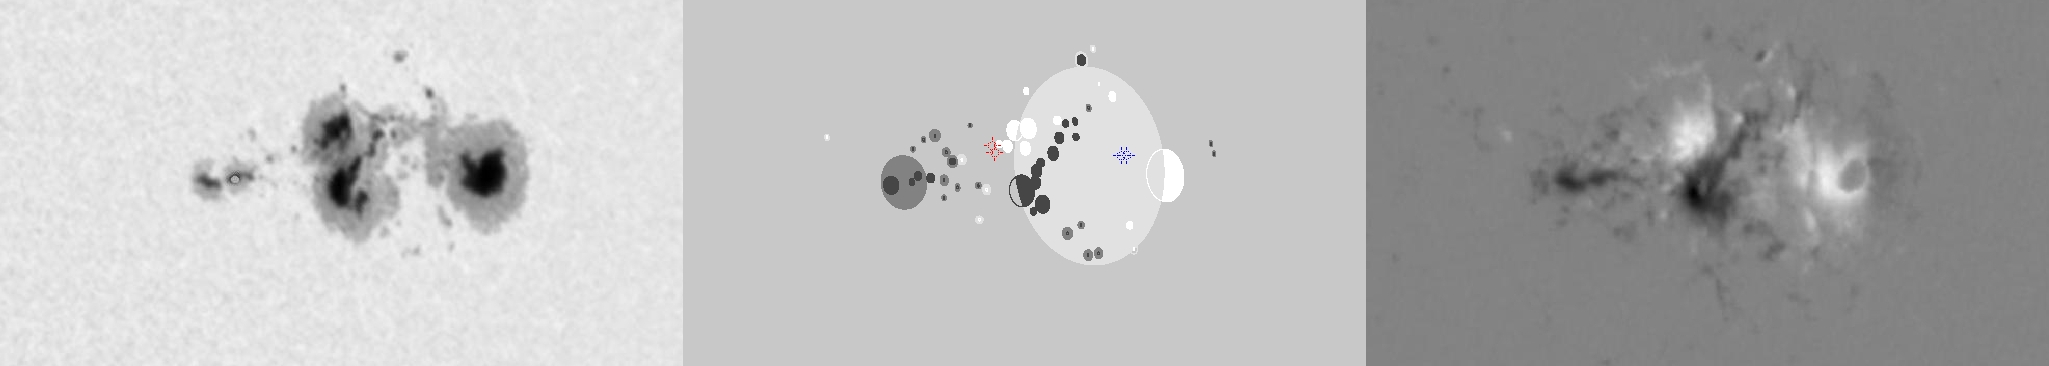
| Evolution of sunspot group NOAA 10488 and positions of flares in it animated by using the data of SOHO/MDI Debrecen Data (SDD) sunspot catalogue (lower panel, middle, ellipses with positions and areas corresponding to the relevant data of spots in SDD and with grey-scale colour coding of the magnetic polarities corresponding to that of the magnetograms), SOHO/MDI continuum images (lower panel, left) and magnetograms (lower panel, right), SOHO/EIT images (upper panel, middle), GOES and RHESSI flare data (red and blue symbols) observed within the interval around the time of SDD data. |
|
When you want to zoom in on one of the images, simply move the mouse pointer over that image. |
 |
| Year | Month | Day | Hour | Min | Sec | NOAA | Proj.U | Proj.WS | Corr.U | Corr.WS | B | L | LCM | Pos.angle | r | MU | MP |
|---|---|---|---|---|---|---|---|---|---|---|---|---|---|---|---|---|---|
| 2003 | 10 | 31 | 20 | 47 | 33 | 10488 | 585 | 3591 | 387 | 2372 | 7.73 | 291.89 | 41.45 | 276.80 | 0.6615 | 97.5 | 148.5 |
| Flare | Date | Start | Peak | End | Dur [s] | Peak [c/s] | Total Counts | Energy [keV] | X pos [asec] | Y pos [asec] | Radial [asec] | B [deg] | L [deg] | Flags |
|---|---|---|---|---|---|---|---|---|---|---|---|---|---|---|
| 3103122 | 31-Oct-2003 | 20:15:32 | 20:18:02 | 20:20:56 | 324 | 32 | 40946 | 12-25 | 529 | -320 | 619 | -15.71 | 284.37 | A1 DF DR P1 PE |
| 3103177 | 31-Oct-2003 | 20:20:56 | 20:39:26 | 20:49:00 | 1684 | 161 | 925008 | 12-25 | 592 | 86 | 599 | 8.69 | 287.83 | A1 DF DR P1 PE |
| 3103172 | 31-Oct-2003 | 20:49:00 | 21:02:14 | 21:11:00 | 1320 | 448 | 2095968 | 25-50 | 599 | 82 | 605 | 8.42 | 288.13 | A1 DF DR P1 |
| Date | Start | Peak | End | Classification | B [deg] | LCM [deg] |
|---|---|---|---|---|---|---|
| 31-Oct-2003 | 20:14 | 20:39 | 20:49 | C5.1 | 08 | 44 |
| 31-Oct-2003 | 20:50 | 21:11 | 21:41 | C9.5 | 08 | 44 |

