move the mouse pointer over that image.
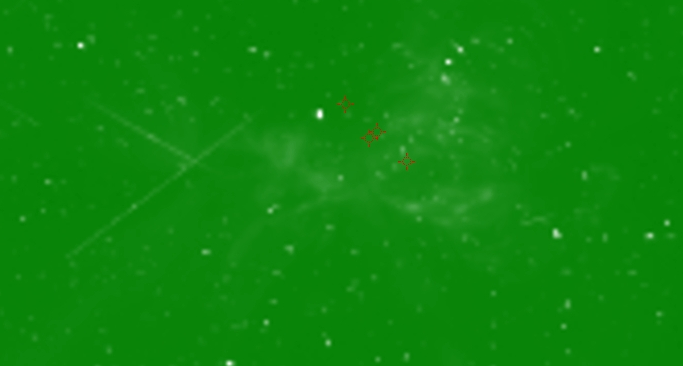
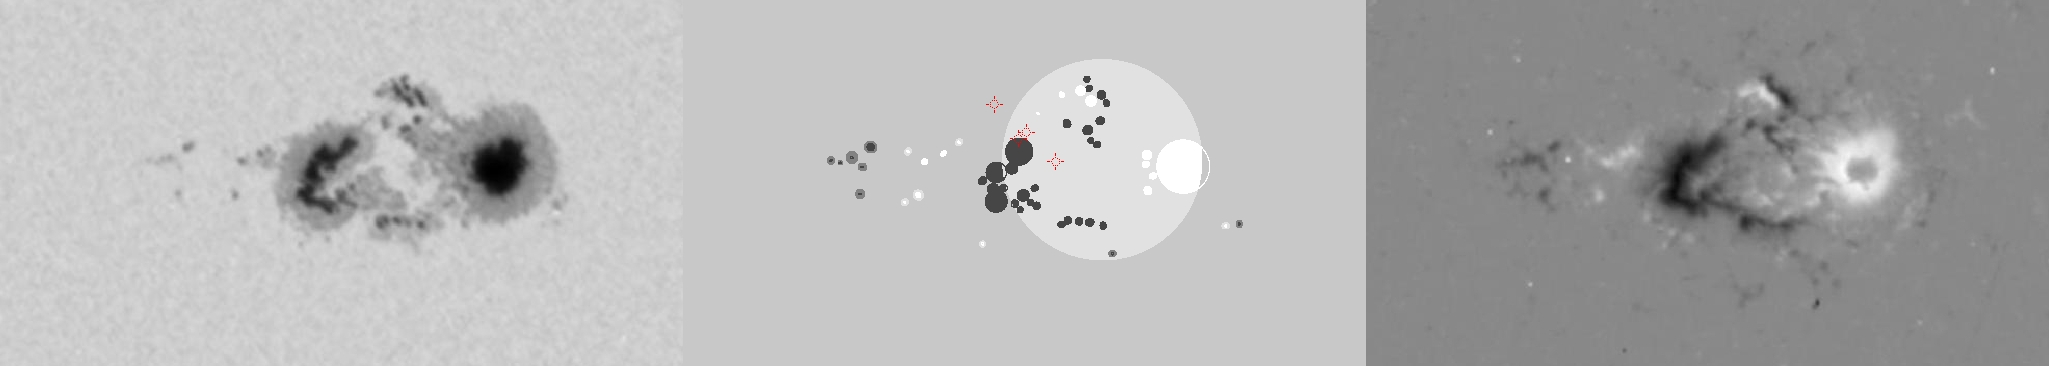
| Evolution of sunspot group NOAA 10488 and positions of flares in it animated by using the data of SOHO/MDI Debrecen Data (SDD) sunspot catalogue (lower panel, middle, ellipses with positions and areas corresponding to the relevant data of spots in SDD and with grey-scale colour coding of the magnetic polarities corresponding to that of the magnetograms), SOHO/MDI continuum images (lower panel, left) and magnetograms (lower panel, right), SOHO/EIT images (upper panel, middle), GOES and RHESSI flare data (red and blue symbols) observed within the interval around the time of SDD data. |
|
When you want to zoom in on one of the images, simply move the mouse pointer over that image. |
 |
| Year | Month | Day | Hour | Min | Sec | NOAA | Proj.U | Proj.WS | Corr.U | Corr.WS | B | L | LCM | Pos.angle | r | MU | MP |
|---|---|---|---|---|---|---|---|---|---|---|---|---|---|---|---|---|---|
| 2003 | 10 | 29 | 07 | 59 | 33 | 10488 | 707 | 4352 | 351 | 2187 | 7.77 | 293.35 | 9.51 | 288.78 | 0.1735 | -32.4 | 14.9 |
| Flare | Date | Start | Peak | End | Dur [s] | Peak [c/s] | Total Counts | Energy [keV] | X pos [asec] | Y pos [asec] | Radial [asec] | B [deg] | L [deg] | Flags |
|---|---|---|---|---|---|---|---|---|---|---|---|---|---|---|
| 3102989 | 29-Oct-2003 | 09:29:24 | 09:32:14 | 09:37:00 | 456 | 68 | 109208 | 6-12 | 178 | 55 | 186 | 7.96 | 292.59 | a0 A1 DF DR P1 PE |
| 3102907 | 29-Oct-2003 | 10:30:16 | 10:31:26 | 10:36:52 | 396 | 1520 | 2382744 | 12-25 | 157 | 91 | 182 | 10.13 | 290.83 | A0 DF ES GE P1 PE |
| 3102969 | 29-Oct-2003 | 11:07:28 | 11:12:10 | 11:15:48 | 500 | 624 | 1355904 | 6-12 | 189 | 74 | 203 | 9.08 | 292.38 | A0 DF DR GS P1 PE |
| 31029104 | 29-Oct-2003 | 11:18:56 | 11:25:10 | 11:31:36 | 760 | 848 | 2241360 | 12-25 | 188 | 70 | 201 | 8.84 | 292.19 | A0 DF P1 |
| Date | Start | Peak | End | Classification | B [deg] | LCM [deg] |
|---|---|---|---|---|---|---|
| No data |

