move the mouse pointer over that image.
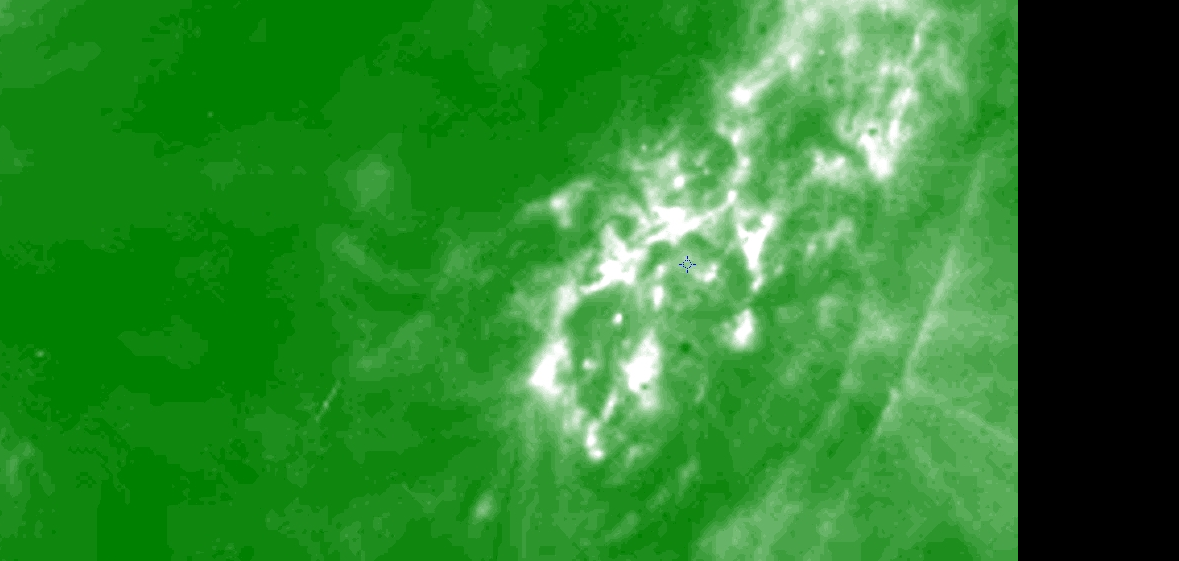
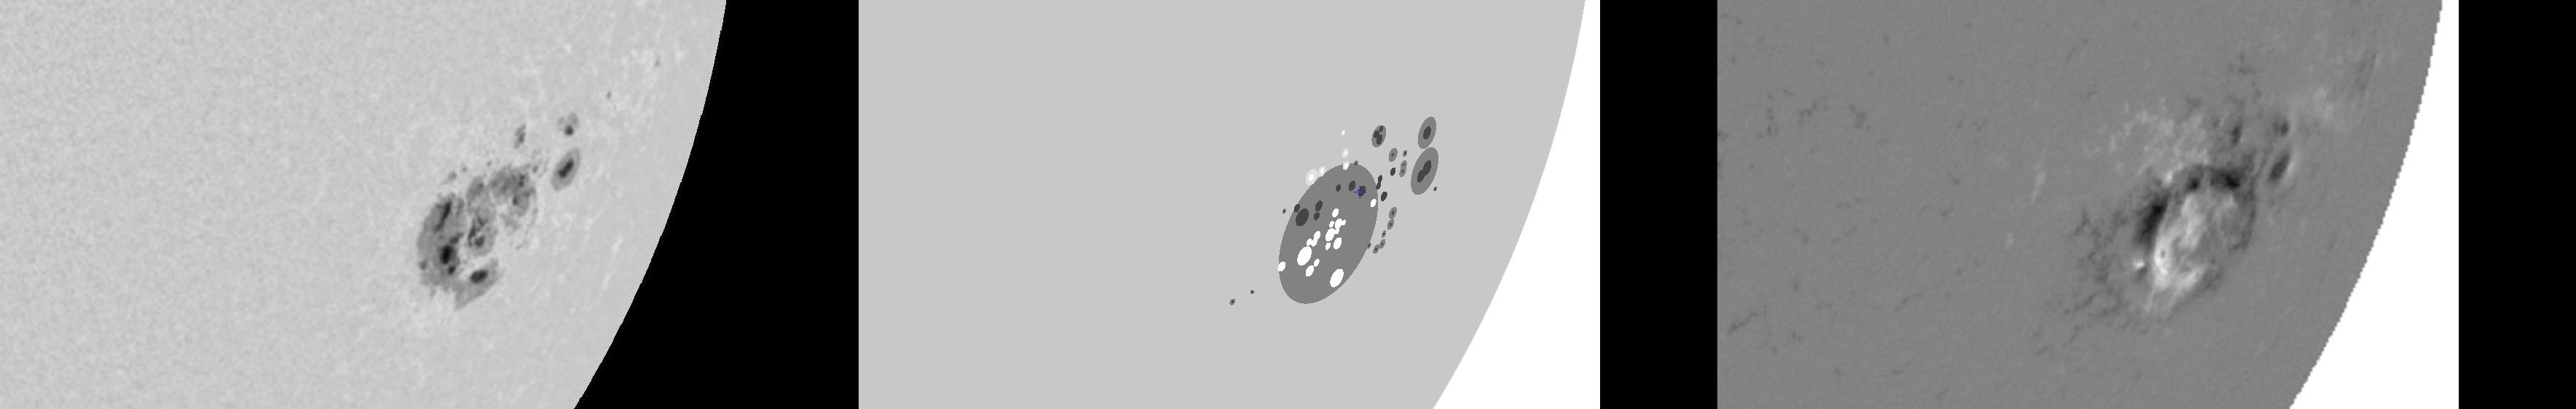
| Evolution of sunspot group NOAA 10486 and positions of flares in it animated by using the data of SOHO/MDI Debrecen Data (SDD) sunspot catalogue (lower panel, middle, ellipses with positions and areas corresponding to the relevant data of spots in SDD and with grey-scale colour coding of the magnetic polarities corresponding to that of the magnetograms), SOHO/MDI continuum images (lower panel, left) and magnetograms (lower panel, right), SOHO/EIT images (upper panel, middle), GOES and RHESSI flare data (red and blue symbols) observed within the interval around the time of SDD data. |
|
When you want to zoom in on one of the images, simply move the mouse pointer over that image. |
 |
| Year | Month | Day | Hour | Min | Sec | NOAA | Proj.U | Proj.WS | Corr.U | Corr.WS | B | L | LCM | Pos.angle | r | MU | MP |
|---|---|---|---|---|---|---|---|---|---|---|---|---|---|---|---|---|---|
| 2003 | 11 | 02 | 07 | 59 | 33 | 10486 | 405 | 3004 | 383 | 2820 | -18.29 | 285.42 | 54.30 | 245.26 | 0.8500 | 13.9 | -137.8 |
| Flare | Date | Start | Peak | End | Dur [s] | Peak [c/s] | Total Counts | Energy [keV] | X pos [asec] | Y pos [asec] | Radial [asec] | B [deg] | L [deg] | Flags |
|---|---|---|---|---|---|---|---|---|---|---|---|---|---|---|
| 3110216 | 2-Nov-2003 | 07:50:40 | 07:51:38 | 08:16:44 | 1564 | 352 | 967920 | 12-25 | 854 | 119 | 862 | 9.05 | 294.16 | A1 DR GS P1 |
| Date | Start | Peak | End | Classification | B [deg] | LCM [deg] |
|---|---|---|---|---|---|---|
| 2-Nov-2003 | 06:59 | 07:53 | 08:12 | M1.0 | -17 | 55 |

