move the mouse pointer over that image.
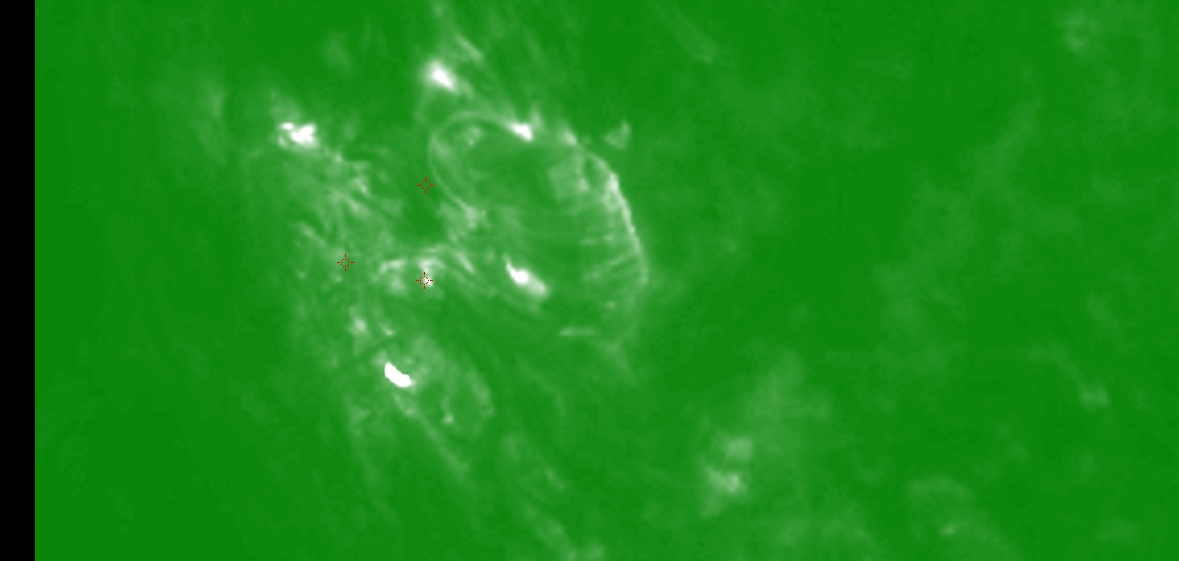
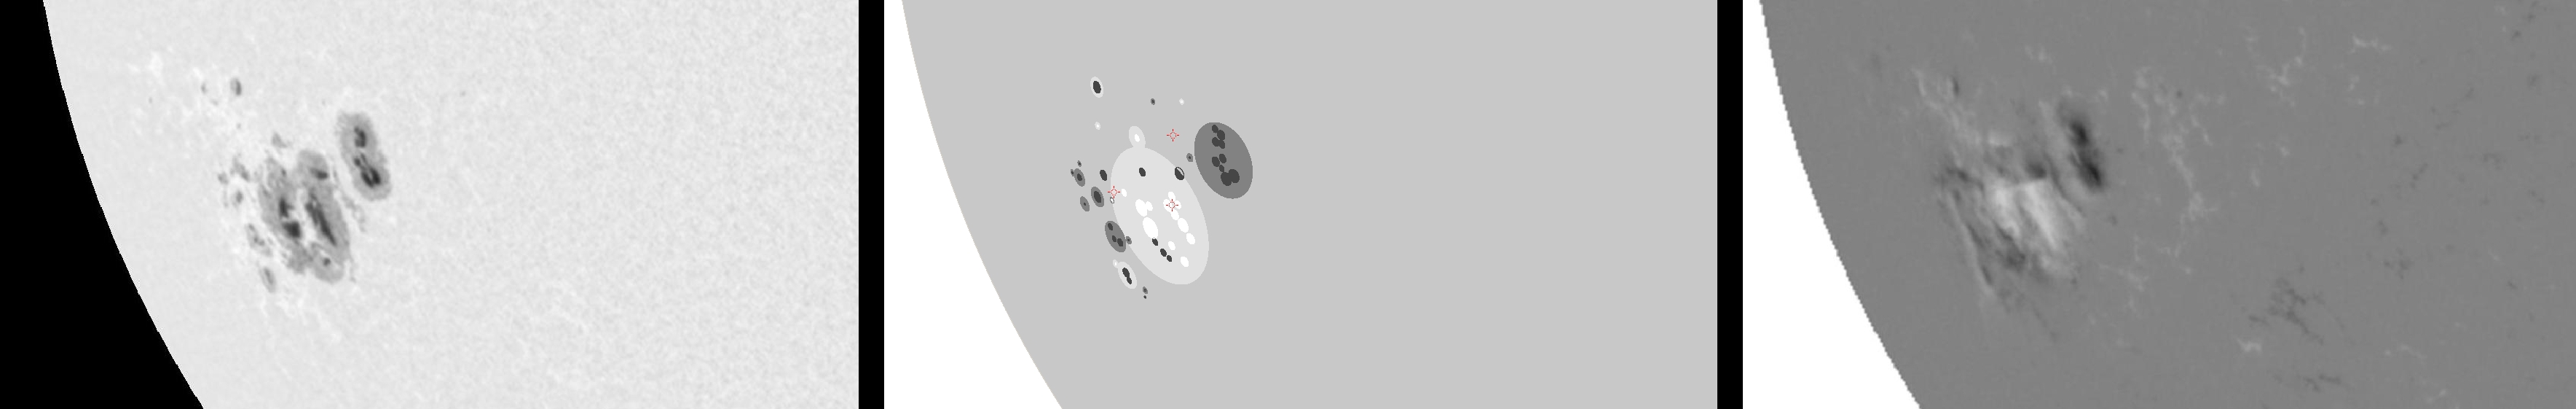
| Evolution of sunspot group NOAA 10486 and positions of flares in it animated by using the data of SOHO/MDI Debrecen Data (SDD) sunspot catalogue (lower panel, middle, ellipses with positions and areas corresponding to the relevant data of spots in SDD and with grey-scale colour coding of the magnetic polarities corresponding to that of the magnetograms), SOHO/MDI continuum images (lower panel, left) and magnetograms (lower panel, right), SOHO/EIT images (upper panel, middle), GOES and RHESSI flare data (red and blue symbols) observed within the interval around the time of SDD data. |
|
When you want to zoom in on one of the images, simply move the mouse pointer over that image. |
 |
| Year | Month | Day | Hour | Min | Sec | NOAA | Proj.U | Proj.WS | Corr.U | Corr.WS | B | L | LCM | Pos.angle | r | MU | MP |
|---|---|---|---|---|---|---|---|---|---|---|---|---|---|---|---|---|---|
| 2003 | 10 | 25 | 07 | 59 | 33 | 10486 | 467 | 3675 | 410 | 3258 | -17.87 | 284.74 | -51.83 | 115.53 | 0.8295 | -20.5 | 70.3 |
| Flare | Date | Start | Peak | End | Dur [s] | Peak [c/s] | Total Counts | Energy [keV] | X pos [asec] | Y pos [asec] | Radial [asec] | B [deg] | L [deg] | Flags |
|---|---|---|---|---|---|---|---|---|---|---|---|---|---|---|
| 3102512 | 25-Oct-2003 | 07:11:20 | 07:17:50 | 07:27:00 | 940 | 32 | 125712 | 6-12 | -708 | -347 | 789 | -17.94 | 285.11 | A0 DF DR GE P1 PE |
| 3102545 | 25-Oct-2003 | 07:51:12 | 07:53:18 | 08:00:24 | 552 | 10 | 28501 | 12-25 | -700 | -288 | 757 | -14.06 | 286.88 | A0 DF DR P1 |
| 3102575 | 25-Oct-2003 | 08:05:28 | 08:11:38 | 08:12:56 | 448 | 73 | 53750 | 12-25 | -749 | -337 | 821 | -17.61 | 280.49 | A0 a1 DF EE P1 |
| Date | Start | Peak | End | Classification | B [deg] | LCM [deg] |
|---|---|---|---|---|---|---|
| No data |

