move the mouse pointer over that image.
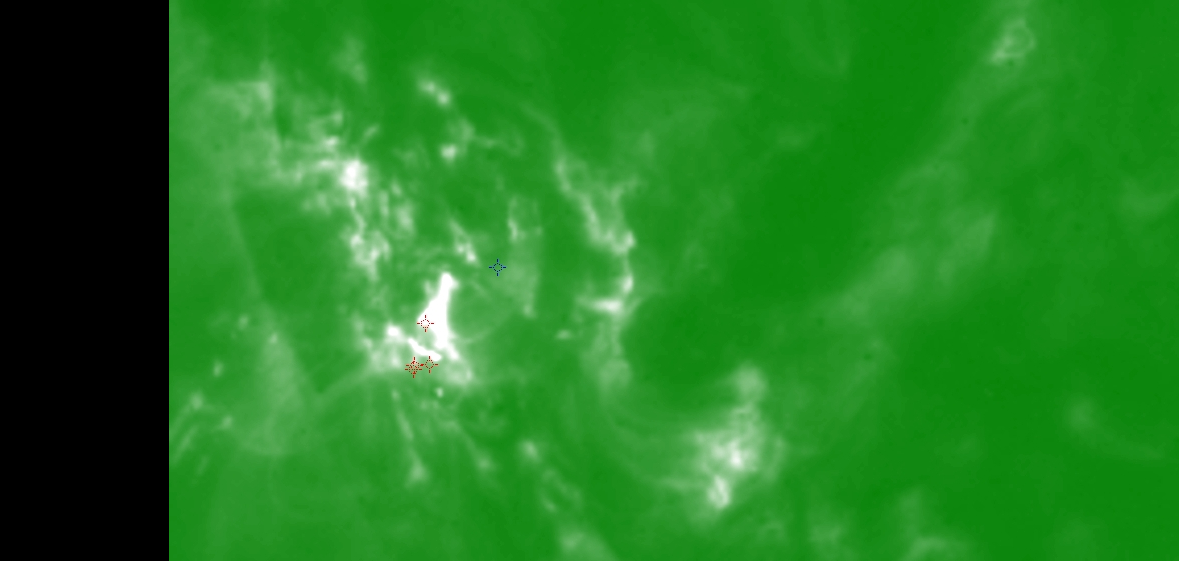
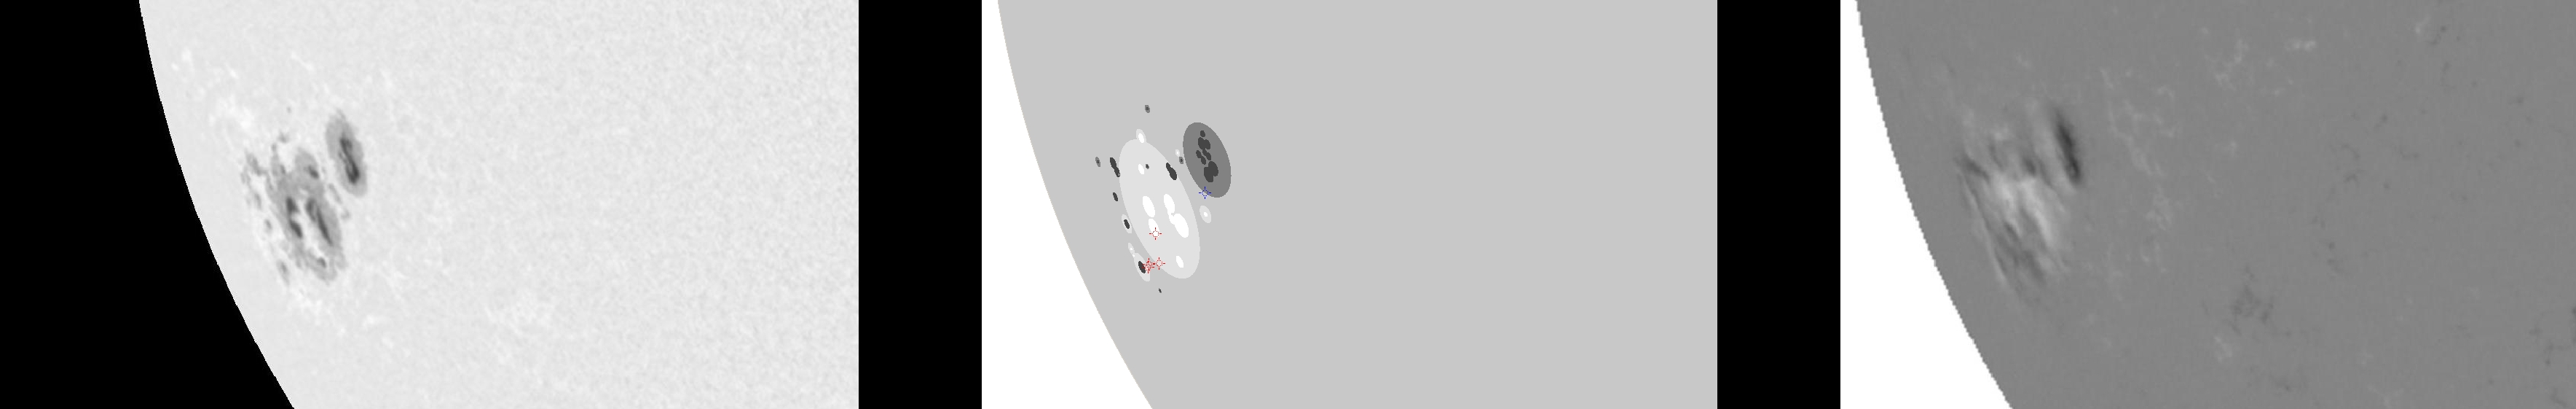
| Evolution of sunspot group NOAA 10486 and positions of flares in it animated by using the data of SOHO/MDI Debrecen Data (SDD) sunspot catalogue (lower panel, middle, ellipses with positions and areas corresponding to the relevant data of spots in SDD and with grey-scale colour coding of the magnetic polarities corresponding to that of the magnetograms), SOHO/MDI continuum images (lower panel, left) and magnetograms (lower panel, right), SOHO/EIT images (upper panel, middle), GOES and RHESSI flare data (red and blue symbols) observed within the interval around the time of SDD data. |
|
When you want to zoom in on one of the images, simply move the mouse pointer over that image. |
 |
| Year | Month | Day | Hour | Min | Sec | NOAA | Proj.U | Proj.WS | Corr.U | Corr.WS | B | L | LCM | Pos.angle | r | MU | MP |
|---|---|---|---|---|---|---|---|---|---|---|---|---|---|---|---|---|---|
| 2003 | 10 | 24 | 14 | 23 | 33 | 10486 | 358 | 2648 | 412 | 3044 | -17.73 | 285.10 | -61.13 | 112.44 | 0.9023 | 79.8 | 80.4 |
| Flare | Date | Start | Peak | End | Dur [s] | Peak [c/s] | Total Counts | Energy [keV] | X pos [asec] | Y pos [asec] | Radial [asec] | B [deg] | L [deg] | Flags |
|---|---|---|---|---|---|---|---|---|---|---|---|---|---|---|
| 3102461 | 24-Oct-2003 | 15:17:04 | 15:35:22 | 15:35:40 | 1116 | 176 | 258790 | 6-12 | -791 | -364 | 871 | -19.81 | 283.41 | a0 A1 DF GE P1 PE |
| 31024119 | 24-Oct-2003 | 16:02:08 | 16:08:46 | 16:11:44 | 576 | 224 | 585840 | 12-25 | -784 | -390 | 875 | -21.52 | 282.84 | A1 EE GS P1 |
| 3102439 | 24-Oct-2003 | 16:46:08 | 16:51:58 | 17:14:20 | 1692 | 224 | 1833816 | 12-25 | -788 | -392 | 881 | -21.71 | 281.76 | A1 P1 PE |
| 31024139 | 24-Oct-2003 | 17:14:20 | 17:17:50 | 17:18:04 | 224 | 200 | 216504 | 12-25 | -786 | -395 | 880 | -21.90 | 281.66 | A1 GE P1 PE |
| Date | Start | Peak | End | Classification | B [deg] | LCM [deg] |
|---|---|---|---|---|---|---|
| 24-Oct-2003 | 15:23 | 17:12 | 18:42 | C8.9 | -17 | -55 |

