
move the mouse pointer over that image.
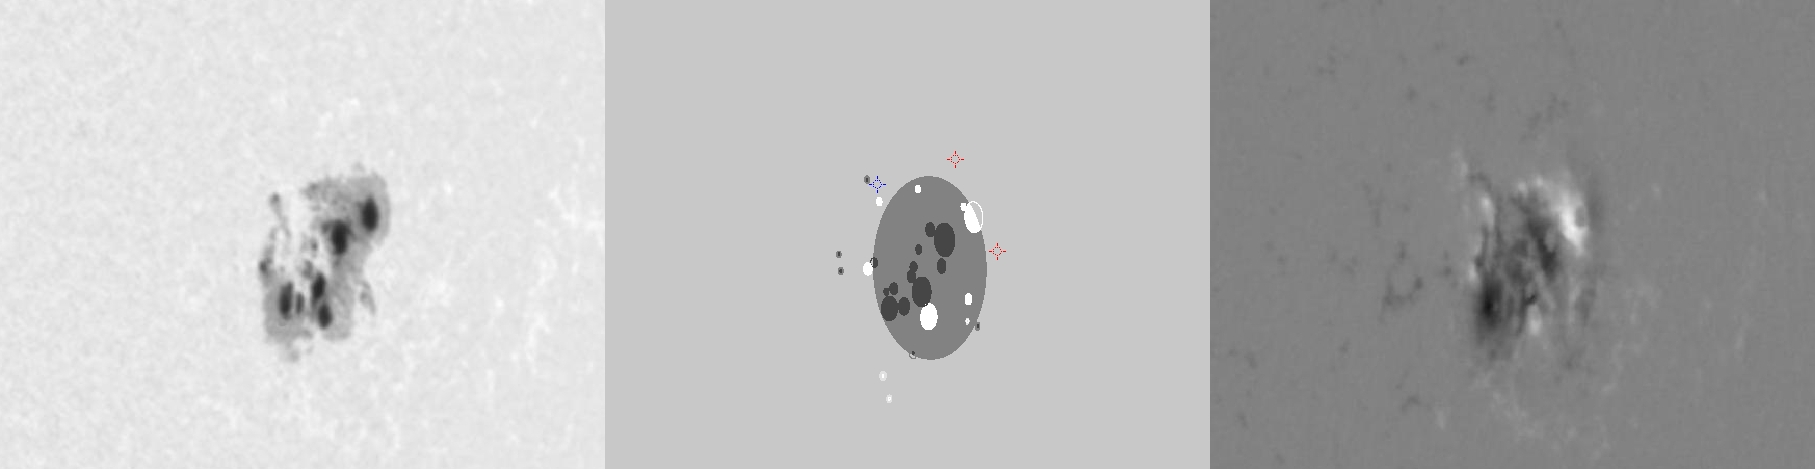
| Evolution of sunspot group NOAA 10484 and positions of flares in it animated by using the data of SOHO/MDI Debrecen Data (SDD) sunspot catalogue (lower panel, middle, ellipses with positions and areas corresponding to the relevant data of spots in SDD and with grey-scale colour coding of the magnetic polarities corresponding to that of the magnetograms), SOHO/MDI continuum images (lower panel, left) and magnetograms (lower panel, right), SOHO/EIT images (upper panel, middle), GOES and RHESSI flare data (red and blue symbols) observed within the interval around the time of SDD data. |
|
When you want to zoom in on one of the images, simply move the mouse pointer over that image. |
 |
| Year | Month | Day | Hour | Min | Sec | NOAA | Proj.U | Proj.WS | Corr.U | Corr.WS | B | L | LCM | Pos.angle | r | MU | MP |
|---|---|---|---|---|---|---|---|---|---|---|---|---|---|---|---|---|---|
| 2003 | 10 | 27 | 19 | 11 | 33 | 10484 | 401 | 2222 | 323 | 1797 | 3.80 | 356.43 | 52.37 | 271.09 | 0.7924 | -451.7 | -234.8 |
| Flare | Date | Start | Peak | End | Dur [s] | Peak [c/s] | Total Counts | Energy [keV] | X pos [asec] | Y pos [asec] | Radial [asec] | B [deg] | L [deg] | Flags |
|---|---|---|---|---|---|---|---|---|---|---|---|---|---|---|
| 3102718 | 27-Oct-2003 | 18:27:24 | 18:29:02 | 18:32:12 | 288 | 33 | 32241 | 12-25 | 779 | 80 | 783 | 7.63 | 358.12 | A0 DF ES P1 |
| 3102778 | 27-Oct-2003 | 18:58:52 | 19:01:06 | 19:02:52 | 240 | 43 | 49683 | 12-25 | 810 | 23 | 810 | 4.02 | 360.64 | A0 a1 DF GE P1 PE |
| Date | Start | Peak | End | Classification | B [deg] | LCM [deg] |
|---|---|---|---|---|---|---|
| 27-Oct-2003 | 19:48 | 19:57 | 20:16 | C9.0 | 07 | 50 |

