move the mouse pointer over that image.
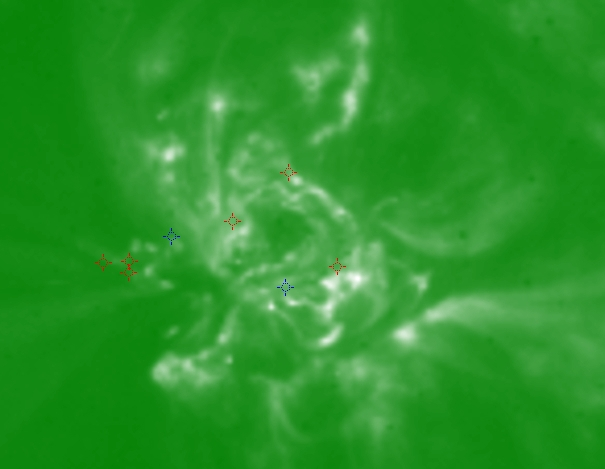
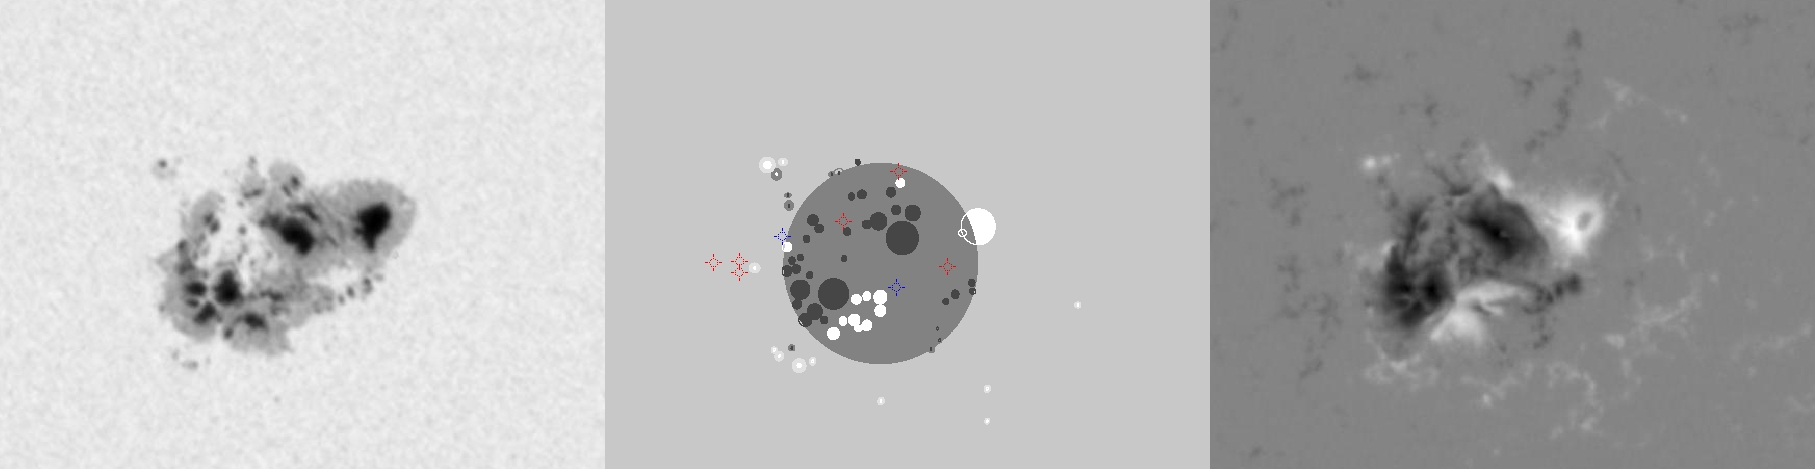
| Evolution of sunspot group NOAA 10484 and positions of flares in it animated by using the data of SOHO/MDI Debrecen Data (SDD) sunspot catalogue (lower panel, middle, ellipses with positions and areas corresponding to the relevant data of spots in SDD and with grey-scale colour coding of the magnetic polarities corresponding to that of the magnetograms), SOHO/MDI continuum images (lower panel, left) and magnetograms (lower panel, right), SOHO/EIT images (upper panel, middle), GOES and RHESSI flare data (red and blue symbols) observed within the interval around the time of SDD data. |
|
When you want to zoom in on one of the images, simply move the mouse pointer over that image. |
 |
| Year | Month | Day | Hour | Min | Sec | NOAA | Proj.U | Proj.WS | Corr.U | Corr.WS | B | L | LCM | Pos.angle | r | MU | MP |
|---|---|---|---|---|---|---|---|---|---|---|---|---|---|---|---|---|---|
| 2003 | 10 | 25 | 03 | 11 | 33 | 10484 | 759 | 4277 | 396 | 2209 | 4.05 | 355.58 | 16.38 | 266.91 | 0.2841 | -679.4 | -231.4 |
| Flare | Date | Start | Peak | End | Dur [s] | Peak [c/s] | Total Counts | Energy [keV] | X pos [asec] | Y pos [asec] | Radial [asec] | B [deg] | L [deg] | Flags |
|---|---|---|---|---|---|---|---|---|---|---|---|---|---|---|
| 3102503 | 25-Oct-2003 | 02:30:16 | 02:31:50 | 02:36:52 | 396 | 10 | 11809 | 12-25 | 291 | 40 | 294 | 7.30 | 356.17 | A0 DF P1 |
| 3102569 | 25-Oct-2003 | 02:36:52 | 02:37:50 | 02:43:40 | 408 | 5 | 6687 | 6-12 | 258 | 9 | 258 | 5.51 | 353.99 | A0 DF P1 |
| 3102570 | 25-Oct-2003 | 02:43:40 | 03:00:02 | 03:02:52 | 1152 | 76 | 81079 | 12-25 | 184 | -17 | 185 | 4.06 | 349.22 | a0 A1 DF DR P1 PE |
| 3102506 | 25-Oct-2003 | 03:02:52 | 03:04:06 | 03:07:04 | 252 | 31 | 25986 | 6-12 | 201 | -23 | 202 | 3.68 | 350.21 | A0 a1 DF DR P1 |
| 3102571 | 25-Oct-2003 | 03:07:04 | 03:09:18 | 03:15:12 | 488 | 20 | 26180 | 12-25 | 203 | -16 | 204 | 4.10 | 350.29 | A0 DF DR P1 |
| 3102560 | 25-Oct-2003 | 03:15:12 | 03:19:10 | 03:24:24 | 552 | 11 | 25891 | 6-12 | 335 | -19 | 336 | 3.71 | 358.40 | A0 DF P1 |
| Date | Start | Peak | End | Classification | B [deg] | LCM [deg] |
|---|---|---|---|---|---|---|
| 25-Oct-2003 | 02:56 | 03:00 | 03:04 | C2.6 | 03 | 17 |
| 25-Oct-2003 | 03:36 | 03:41 | 03:47 | C3.9 | 05 | 13 |

