move the mouse pointer over that image.
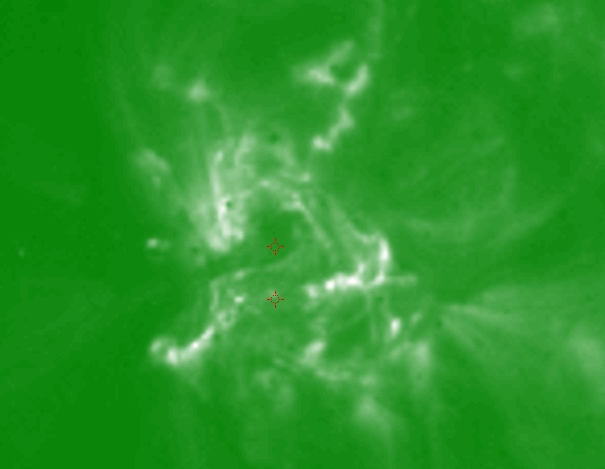
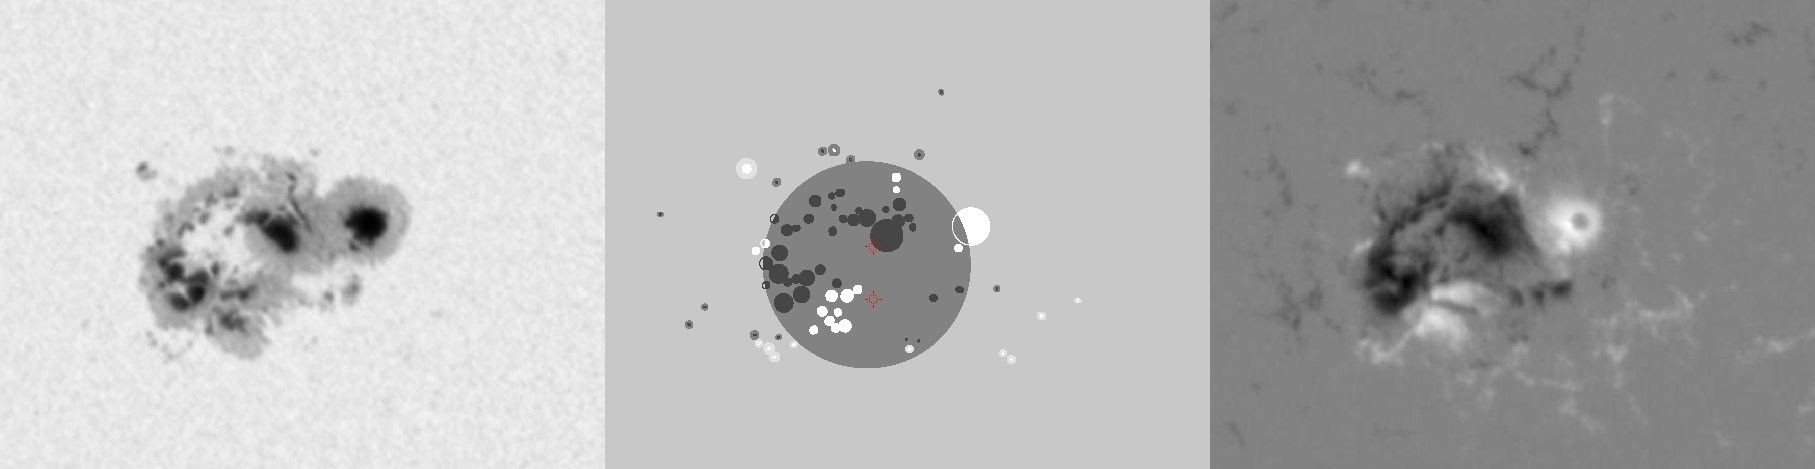
| Evolution of sunspot group NOAA 10484 and positions of flares in it animated by using the data of SOHO/MDI Debrecen Data (SDD) sunspot catalogue (lower panel, middle, ellipses with positions and areas corresponding to the relevant data of spots in SDD and with grey-scale colour coding of the magnetic polarities corresponding to that of the magnetograms), SOHO/MDI continuum images (lower panel, left) and magnetograms (lower panel, right), SOHO/EIT images (upper panel, middle), GOES and RHESSI flare data (red and blue symbols) observed within the interval around the time of SDD data. |
|
When you want to zoom in on one of the images, simply move the mouse pointer over that image. |
 |
| Year | Month | Day | Hour | Min | Sec | NOAA | Proj.U | Proj.WS | Corr.U | Corr.WS | B | L | LCM | Pos.angle | r | MU | MP |
|---|---|---|---|---|---|---|---|---|---|---|---|---|---|---|---|---|---|
| 2003 | 10 | 24 | 06 | 44 | 33 | 10484 | 786 | 4726 | 393 | 2351 | 4.33 | 355.38 | 4.95 | 261.37 | 0.0874 | -641.2 | -193.5 |
| Flare | Date | Start | Peak | End | Dur [s] | Peak [c/s] | Total Counts | Energy [keV] | X pos [asec] | Y pos [asec] | Radial [asec] | B [deg] | L [deg] | Flags |
|---|---|---|---|---|---|---|---|---|---|---|---|---|---|---|
| 3102477 | 24-Oct-2003 | 07:09:40 | 07:12:10 | 07:17:20 | 460 | 3 | 6079 | 6-12 | 118 | -45 | 126 | 2.52 | 356.10 | A0 DF DR P1 |
| 31024133 | 24-Oct-2003 | 07:17:20 | 07:19:42 | 07:22:12 | 292 | 4 | 4745 | 12-25 | 120 | -12 | 121 | 4.48 | 356.17 | A0 DF P1 |
| Date | Start | Peak | End | Classification | B [deg] | LCM [deg] |
|---|---|---|---|---|---|---|
| No data |

