move the mouse pointer over that image.
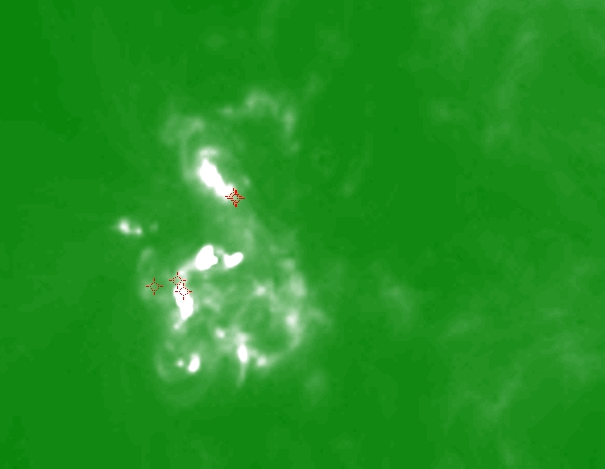
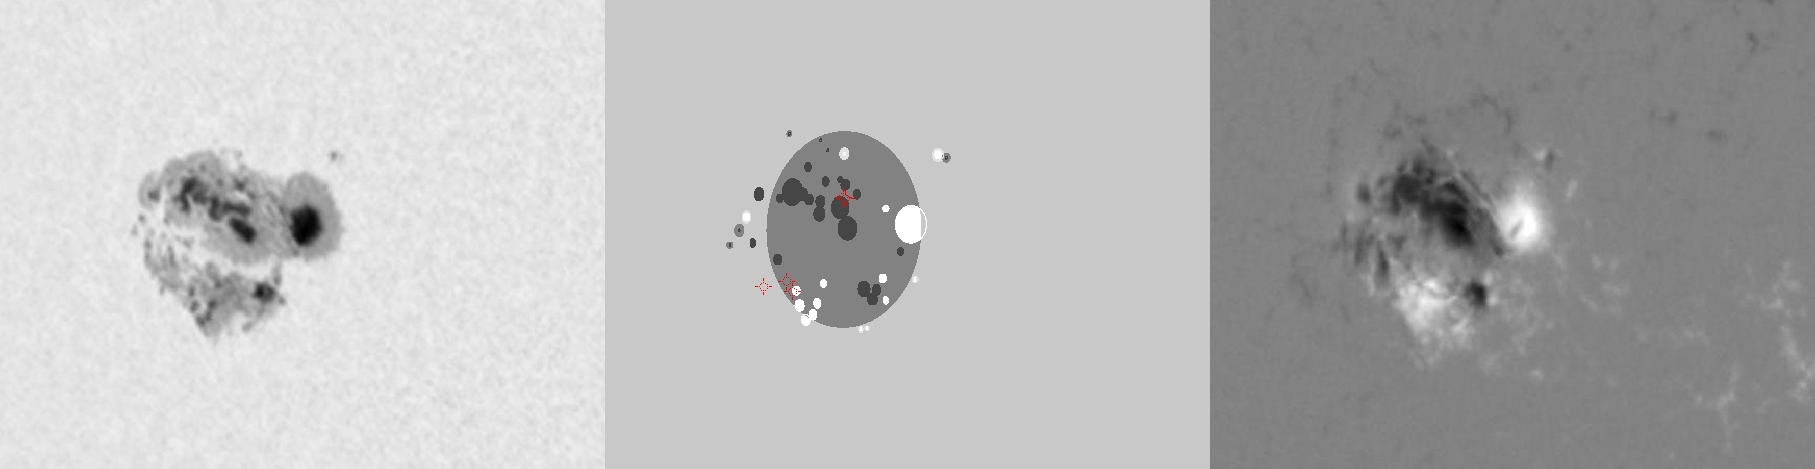
| Evolution of sunspot group NOAA 10484 and positions of flares in it animated by using the data of SOHO/MDI Debrecen Data (SDD) sunspot catalogue (lower panel, middle, ellipses with positions and areas corresponding to the relevant data of spots in SDD and with grey-scale colour coding of the magnetic polarities corresponding to that of the magnetograms), SOHO/MDI continuum images (lower panel, left) and magnetograms (lower panel, right), SOHO/EIT images (upper panel, middle), GOES and RHESSI flare data (red and blue symbols) observed within the interval around the time of SDD data. |
|
When you want to zoom in on one of the images, simply move the mouse pointer over that image. |
 |
| Year | Month | Day | Hour | Min | Sec | NOAA | Proj.U | Proj.WS | Corr.U | Corr.WS | B | L | LCM | Pos.angle | r | MU | MP |
|---|---|---|---|---|---|---|---|---|---|---|---|---|---|---|---|---|---|
| 2003 | 10 | 20 | 22 | 23 | 33 | 10484 | 503 | 3278 | 320 | 2084 | 5.04 | 355.53 | -39.03 | 88.65 | 0.6296 | -244.8 | -4.1 |
| Flare | Date | Start | Peak | End | Dur [s] | Peak [c/s] | Total Counts | Energy [keV] | X pos [asec] | Y pos [asec] | Radial [asec] | B [deg] | L [deg] | Flags |
|---|---|---|---|---|---|---|---|---|---|---|---|---|---|---|
| 3102040 | 20-Oct-2003 | 21:28:00 | 21:35:42 | 21:39:16 | 676 | 117 | 139295 | 12-25 | -599 | 31 | 600 | 6.16 | -4.85 | A0 a1 DF P1 |
| 3102041 | 20-Oct-2003 | 21:41:04 | 21:41:42 | 21:43:16 | 132 | 14 | 7021 | 12-25 | -599 | 32 | 600 | 6.22 | -4.91 | A0 DF P1 |
| 31020101 | 20-Oct-2003 | 21:43:16 | 21:44:34 | 21:45:44 | 148 | 22 | 8689 | 12-25 | -597 | 31 | 598 | 6.17 | -4.77 | A0 DF P1 |
| 31020102 | 20-Oct-2003 | 21:52:08 | 22:01:18 | 22:07:56 | 948 | 752 | 753216 | 25-50 | -630 | -21 | 630 | 2.92 | -7.28 | a0 A1 DF DR P1 |
| 31020157 | 20-Oct-2003 | 22:07:56 | 22:09:26 | 22:13:56 | 360 | 39 | 35680 | 12-25 | -624 | -28 | 625 | 2.54 | -6.87 | A0 a1 DF P1 PE |
| 31020103 | 20-Oct-2003 | 22:13:56 | 22:15:22 | 22:16:28 | 152 | 7 | 4257 | 12-25 | -641 | -25 | 641 | 2.63 | -8.28 | A0 DF GE P1 PE |
| Date | Start | Peak | End | Classification | B [deg] | LCM [deg] |
|---|---|---|---|---|---|---|
| No data |

