move the mouse pointer over that image.
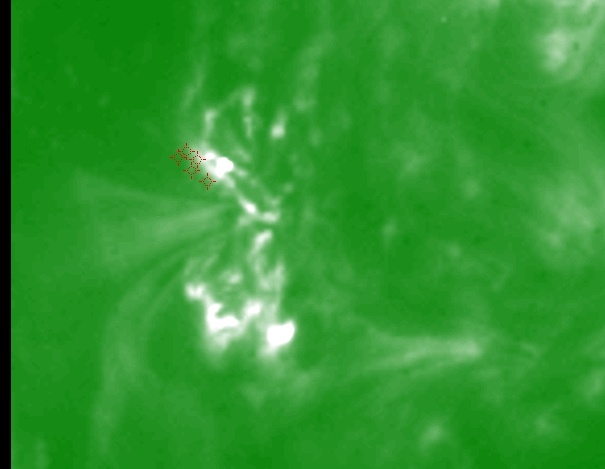
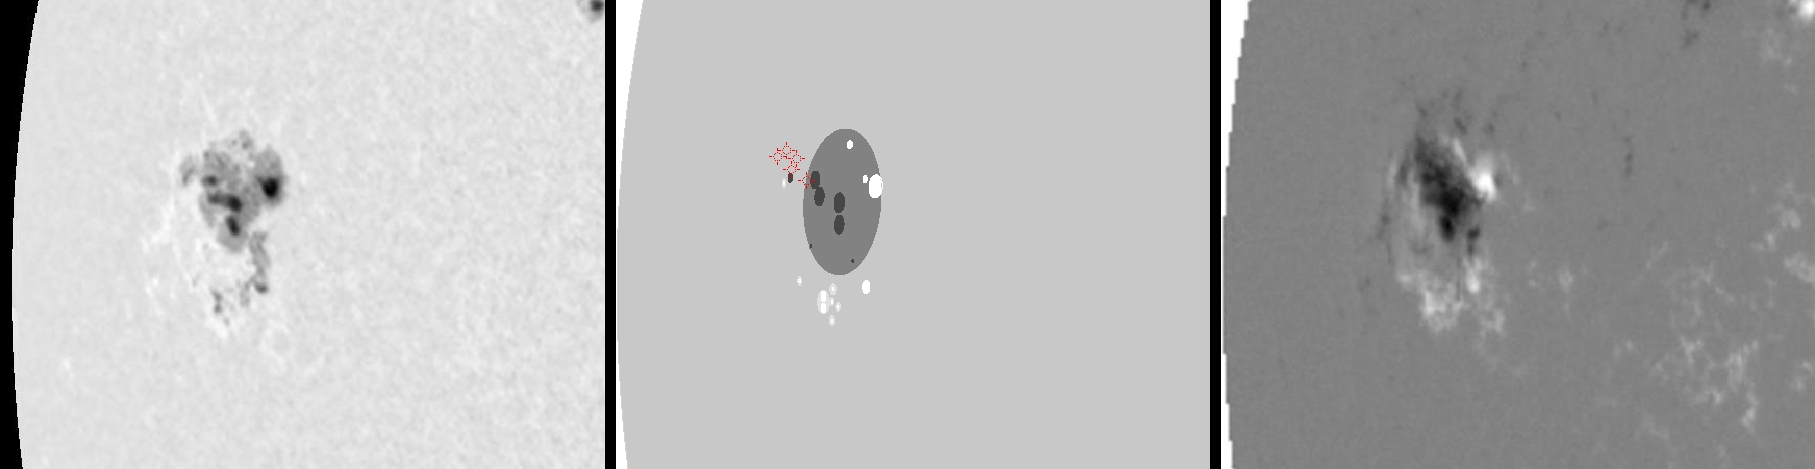
| Evolution of sunspot group NOAA 10484 and positions of flares in it animated by using the data of SOHO/MDI Debrecen Data (SDD) sunspot catalogue (lower panel, middle, ellipses with positions and areas corresponding to the relevant data of spots in SDD and with grey-scale colour coding of the magnetic polarities corresponding to that of the magnetograms), SOHO/MDI continuum images (lower panel, left) and magnetograms (lower panel, right), SOHO/EIT images (upper panel, middle), GOES and RHESSI flare data (red and blue symbols) observed within the interval around the time of SDD data. |
|
When you want to zoom in on one of the images, simply move the mouse pointer over that image. |
 |
| Year | Month | Day | Hour | Min | Sec | NOAA | Proj.U | Proj.WS | Corr.U | Corr.WS | B | L | LCM | Pos.angle | r | MU | MP |
|---|---|---|---|---|---|---|---|---|---|---|---|---|---|---|---|---|---|
| 2003 | 10 | 19 | 11 | 11 | 33 | 10484 | 139 | 1248 | 132 | 1189 | 5.76 | 354.98 | -58.92 | 86.60 | 0.8554 | -163.0 | -157.4 |
| Flare | Date | Start | Peak | End | Dur [s] | Peak [c/s] | Total Counts | Energy [keV] | X pos [asec] | Y pos [asec] | Radial [asec] | B [deg] | L [deg] | Flags |
|---|---|---|---|---|---|---|---|---|---|---|---|---|---|---|
| 3101912 | 19-Oct-2003 | 10:22:12 | 10:27:46 | 10:34:12 | 720 | 656 | 1157424 | 12-25 | -836 | 63 | 838 | 6.51 | -7.88 | A0 DR P1 Q2 |
| 3101950 | 19-Oct-2003 | 10:55:20 | 10:58:02 | 11:06:44 | 684 | 384 | 609696 | 6-12 | -838 | 76 | 841 | 7.25 | -8.57 | A0 DR GS P1 PE |
| 31019104 | 19-Oct-2003 | 11:06:44 | 11:07:14 | 11:13:52 | 428 | 52 | 91872 | 6-12 | -840 | 69 | 843 | 6.82 | -8.81 | A0 DR P1 |
| 3101962 | 19-Oct-2003 | 11:49:52 | 11:50:38 | 11:53:56 | 244 | 400 | 467112 | 6-12 | -837 | 80 | 841 | 7.49 | -8.99 | A0 DR P1 PE |
| 31019105 | 19-Oct-2003 | 11:53:56 | 11:55:38 | 12:06:16 | 740 | 400 | 1314240 | 6-12 | -842 | 76 | 845 | 7.20 | -9.60 | A0 DR P1 |
| Date | Start | Peak | End | Classification | B [deg] | LCM [deg] |
|---|---|---|---|---|---|---|
| No data |

