move the mouse pointer over that image.
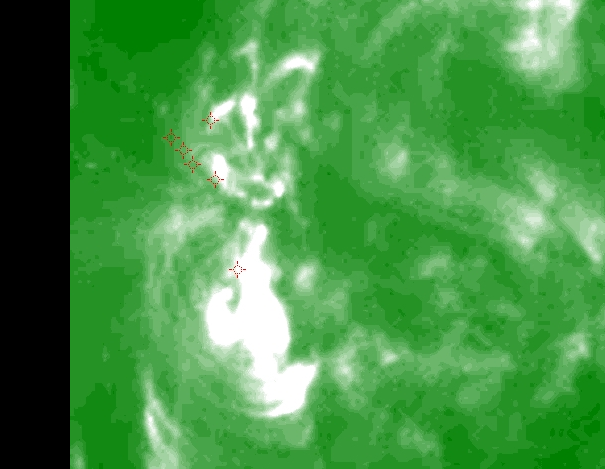
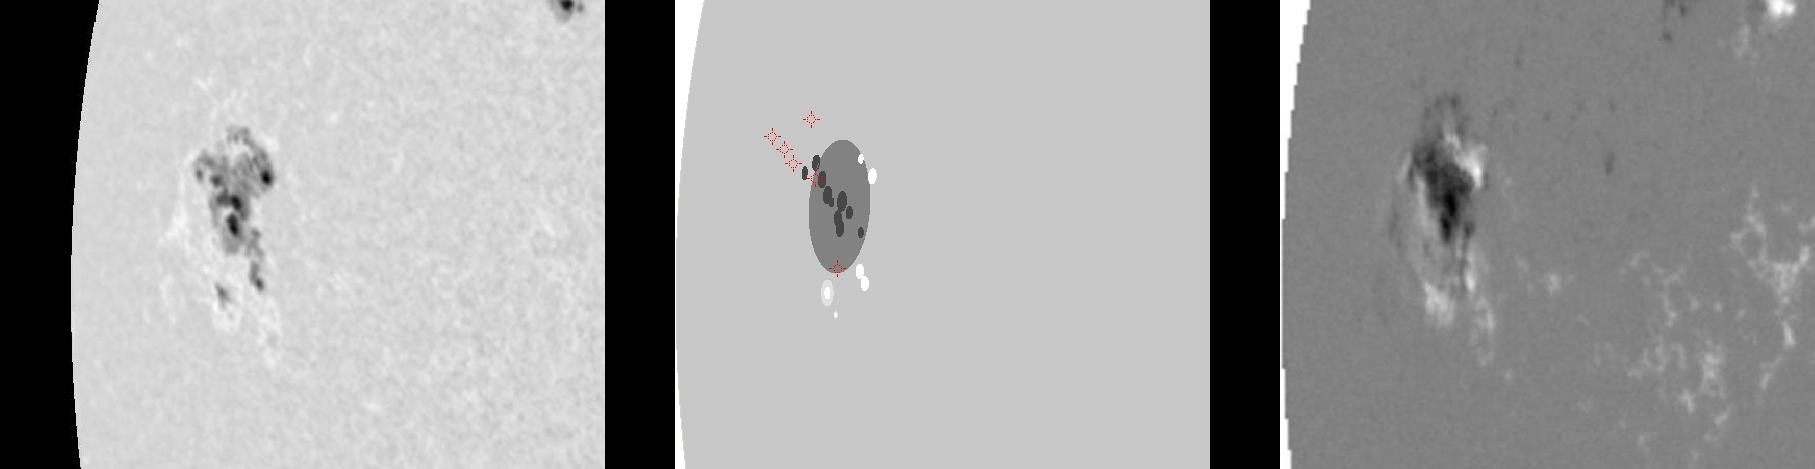
| Evolution of sunspot group NOAA 10484 and positions of flares in it animated by using the data of SOHO/MDI Debrecen Data (SDD) sunspot catalogue (lower panel, middle, ellipses with positions and areas corresponding to the relevant data of spots in SDD and with grey-scale colour coding of the magnetic polarities corresponding to that of the magnetograms), SOHO/MDI continuum images (lower panel, left) and magnetograms (lower panel, right), SOHO/EIT images (upper panel, middle), GOES and RHESSI flare data (red and blue symbols) observed within the interval around the time of SDD data. |
|
When you want to zoom in on one of the images, simply move the mouse pointer over that image. |
 |
| Year | Month | Day | Hour | Min | Sec | NOAA | Proj.U | Proj.WS | Corr.U | Corr.WS | B | L | LCM | Pos.angle | r | MU | MP |
|---|---|---|---|---|---|---|---|---|---|---|---|---|---|---|---|---|---|
| 2003 | 10 | 19 | 03 | 11 | 33 | 10484 | 147 | 881 | 160 | 973 | 5.58 | 354.59 | -63.70 | 86.53 | 0.8954 | -342.8 | -165.1 |
| Flare | Date | Start | Peak | End | Dur [s] | Peak [c/s] | Total Counts | Energy [keV] | X pos [asec] | Y pos [asec] | Radial [asec] | B [deg] | L [deg] | Flags |
|---|---|---|---|---|---|---|---|---|---|---|---|---|---|---|
| 3101994 | 19-Oct-2003 | 02:27:28 | 02:31:22 | 02:42:08 | 880 | 88 | 306034 | 6-12 | -894 | 96 | 899 | 7.71 | -12.34 | A0 DF P1 |
| 3101977 | 19-Oct-2003 | 02:42:08 | 02:46:26 | 02:53:32 | 684 | 120 | 204274 | 12-25 | -851 | 13 | 851 | 3.40 | -5.07 | A0 DF DR P1 |
| 3101947 | 19-Oct-2003 | 02:55:08 | 03:04:30 | 03:10:04 | 896 | 183 | 377212 | 6-12 | -863 | 69 | 865 | 6.56 | -7.42 | A0 DF DR P1 |
| 3101995 | 19-Oct-2003 | 03:10:04 | 03:12:50 | 03:13:56 | 232 | 80 | 72343 | 6-12 | -876 | 78 | 879 | 6.92 | -9.50 | A0 DF P1 |
| 3101980 | 19-Oct-2003 | 03:49:32 | 03:49:58 | 03:52:20 | 168 | 120 | 91848 | 6-12 | -860 | 105 | 866 | 8.71 | -8.02 | A0 DF P1 |
| 3101996 | 19-Oct-2003 | 03:52:20 | 03:55:06 | 04:04:04 | 704 | 200 | 613824 | 6-12 | -877 | 86 | 881 | 7.38 | -10.18 | A0 DF P1 |
| Date | Start | Peak | End | Classification | B [deg] | LCM [deg] |
|---|---|---|---|---|---|---|
| No data |

