move the mouse pointer over that image.
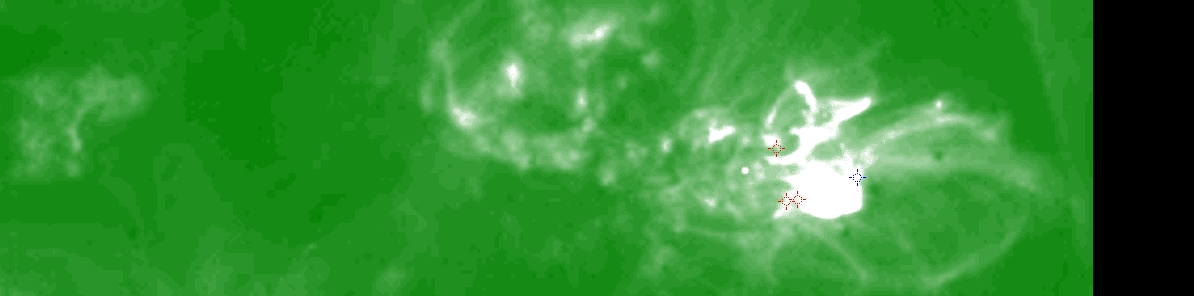
| Evolution of sunspot group NOAA 10375 and positions of flares in it animated by using the data of SOHO/MDI Debrecen Data (SDD) sunspot catalogue (lower panel, middle, ellipses with positions and areas corresponding to the relevant data of spots in SDD and with grey-scale colour coding of the magnetic polarities corresponding to that of the magnetograms), SOHO/MDI continuum images (lower panel, left) and magnetograms (lower panel, right), SOHO/EIT images (upper panel, middle), GOES and RHESSI flare data (red and blue symbols) observed within the interval around the time of SDD data. |
|
When you want to zoom in on one of the images, simply move the mouse pointer over that image. |
 |
| Year | Month | Day | Hour | Min | Sec | NOAA | Proj.U | Proj.WS | Corr.U | Corr.WS | B | L | LCM | Pos.angle | r | MU | MP |
|---|---|---|---|---|---|---|---|---|---|---|---|---|---|---|---|---|---|
| 2003 | 06 | 11 | 07 | 59 | 32 | 10375 | 435 | 2473 | 364 | 2051 | 12.38 | 26.33 | 52.39 | 285.22 | 0.7999 | 387.1 | 233.1 |
| Flare | Date | Start | Peak | End | Dur [s] | Peak [c/s] | Total Counts | Energy [keV] | X pos [asec] | Y pos [asec] | Radial [asec] | B [deg] | L [deg] | Flags |
|---|---|---|---|---|---|---|---|---|---|---|---|---|---|---|
| 3061111 | 11-Jun-2003 | 07:49:08 | 07:54:02 | 08:04:28 | 920 | 26 | 70296 | 6-12 | 771 | 215 | 800 | 13.15 | 388.31 | A1 DF P1 |
| 3061112 | 11-Jun-2003 | 08:23:08 | 08:24:46 | 08:27:24 | 256 | 30 | 23904 | 12-25 | 789 | 183 | 810 | 11.20 | 389.38 | A1 DF P1 |
| 30611102 | 11-Jun-2003 | 08:27:24 | 08:29:34 | 08:33:40 | 376 | 144 | 93816 | 12-25 | 783 | 182 | 804 | 11.14 | 388.65 | A1 DF P1 |
| Date | Start | Peak | End | Classification | B [deg] | LCM [deg] |
|---|---|---|---|---|---|---|
| 11-Jun-2003 | 08:22 | 08:30 | 08:32 | C8.3 | 12 | 60 |

