move the mouse pointer over that image.
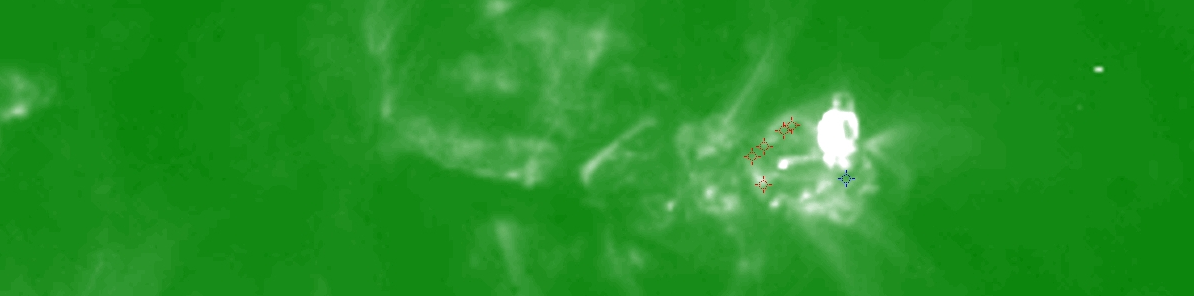
| Evolution of sunspot group NOAA 10375 and positions of flares in it animated by using the data of SOHO/MDI Debrecen Data (SDD) sunspot catalogue (lower panel, middle, ellipses with positions and areas corresponding to the relevant data of spots in SDD and with grey-scale colour coding of the magnetic polarities corresponding to that of the magnetograms), SOHO/MDI continuum images (lower panel, left) and magnetograms (lower panel, right), SOHO/EIT images (upper panel, middle), GOES and RHESSI flare data (red and blue symbols) observed within the interval around the time of SDD data. |
|
When you want to zoom in on one of the images, simply move the mouse pointer over that image. |
 |
| Year | Month | Day | Hour | Min | Sec | NOAA | Proj.U | Proj.WS | Corr.U | Corr.WS | B | L | LCM | Pos.angle | r | MU | MP |
|---|---|---|---|---|---|---|---|---|---|---|---|---|---|---|---|---|---|
| 2003 | 06 | 10 | 06 | 23 | 32 | 10375 | 561 | 2892 | 361 | 1824 | 12.30 | 24.39 | 36.33 | 289.89 | 0.6153 | 253.1 | 242.0 |
| Flare | Date | Start | Peak | End | Dur [s] | Peak [c/s] | Total Counts | Energy [keV] | X pos [asec] | Y pos [asec] | Radial [asec] | B [deg] | L [deg] | Flags |
|---|---|---|---|---|---|---|---|---|---|---|---|---|---|---|
| 3061009 | 10-Jun-2003 | 06:08:36 | 06:20:30 | 06:31:08 | 1352 | 64 | 193632 | 12-25 | 600 | 193 | 631 | 11.79 | 386.53 | A1 |
| 3061011 | 10-Jun-2003 | 06:49:28 | 06:50:06 | 06:53:40 | 252 | 16 | 19200 | 6-12 | 600 | 211 | 636 | 12.88 | 386.46 | A1 |
| 3061013 | 10-Jun-2003 | 08:01:20 | 08:04:22 | 08:08:20 | 420 | 34 | 53040 | 25-50 | 624 | 217 | 660 | 13.25 | 387.79 | A1 |
| 30610105 | 10-Jun-2003 | 08:14:44 | 08:15:06 | 08:16:52 | 128 | 18 | 10920 | 12-25 | 643 | 230 | 683 | 14.04 | 389.46 | A1 |
| 3061075 | 10-Jun-2003 | 08:20:48 | 08:23:58 | 08:26:52 | 364 | 32 | 48672 | 6-12 | 640 | 227 | 679 | 13.86 | 389.08 | A1 |
| Date | Start | Peak | End | Classification | B [deg] | LCM [deg] |
|---|---|---|---|---|---|---|
| 10-Jun-2003 | 08:34 | 08:37 | 08:40 | M2.7 | 12 | 44 |

