move the mouse pointer over that image.
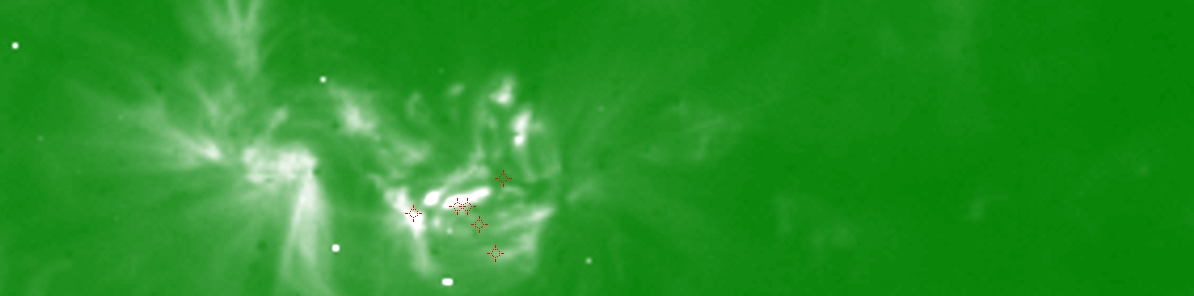
| Evolution of sunspot group NOAA 10375 and positions of flares in it animated by using the data of SOHO/MDI Debrecen Data (SDD) sunspot catalogue (lower panel, middle, ellipses with positions and areas corresponding to the relevant data of spots in SDD and with grey-scale colour coding of the magnetic polarities corresponding to that of the magnetograms), SOHO/MDI continuum images (lower panel, left) and magnetograms (lower panel, right), SOHO/EIT images (upper panel, middle), GOES and RHESSI flare data (red and blue symbols) observed within the interval around the time of SDD data. |
|
When you want to zoom in on one of the images, simply move the mouse pointer over that image. |
 |
| Year | Month | Day | Hour | Min | Sec | NOAA | Proj.U | Proj.WS | Corr.U | Corr.WS | B | L | LCM | Pos.angle | r | MU | MP |
|---|---|---|---|---|---|---|---|---|---|---|---|---|---|---|---|---|---|
| 2003 | 06 | 06 | 01 | 49 | 32 | 10375 | 271 | 1589 | 147 | 867 | 11.90 | 21.83 | -21.70 | 60.09 | 0.4187 | 887.9 | 291.4 |
| Flare | Date | Start | Peak | End | Dur [s] | Peak [c/s] | Total Counts | Energy [keV] | X pos [asec] | Y pos [asec] | Radial [asec] | B [deg] | L [deg] | Flags |
|---|---|---|---|---|---|---|---|---|---|---|---|---|---|---|
| 3060697 | 6-Jun-2003 | 01:03:32 | 01:05:30 | 01:11:36 | 484 | 60 | 54912 | 6-12 | -368 | 186 | 412 | 10.93 | 19.90 | A0 DF DR P1 |
| 3060654 | 6-Jun-2003 | 01:19:28 | 01:20:46 | 01:27:48 | 500 | 56 | 97608 | 6-12 | -341 | 204 | 398 | 12.02 | 21.44 | A0 DF P1 |
| 3060655 | 6-Jun-2003 | 01:32:40 | 01:33:34 | 01:38:12 | 332 | 42 | 44712 | 6-12 | -366 | 186 | 411 | 10.93 | 19.77 | A0 DF DR P1 |
| 3060698 | 6-Jun-2003 | 01:38:12 | 01:39:26 | 01:40:44 | 152 | 20 | 14688 | 6-12 | -351 | 175 | 392 | 10.26 | 20.75 | A0 DF DR P1 |
| 3060656 | 6-Jun-2003 | 01:40:44 | 01:44:46 | 01:48:24 | 460 | 144 | 147264 | 12-25 | -339 | 157 | 374 | 9.17 | 21.56 | A0 DF DR P1 PE |
| 3060601 | 6-Jun-2003 | 01:48:24 | 01:55:50 | 01:59:16 | 652 | 128 | 338256 | 6-12 | -388 | 182 | 429 | 10.69 | 18.14 | A0 DF DR EE P1 PE |
| Date | Start | Peak | End | Classification | B [deg] | LCM [deg] |
|---|---|---|---|---|---|---|
| No data |

