move the mouse pointer over that image.
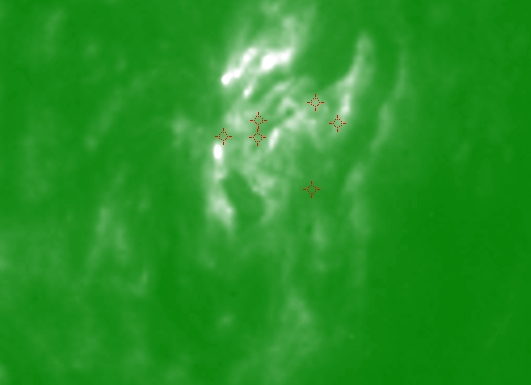
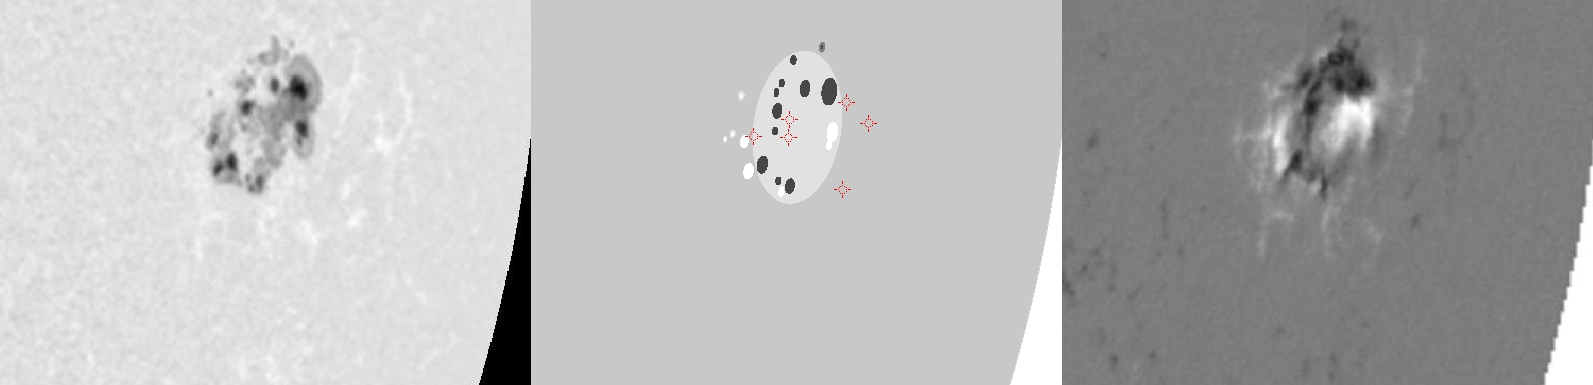
| Evolution of sunspot group NOAA 10365 and positions of flares in it animated by using the data of SOHO/MDI Debrecen Data (SDD) sunspot catalogue (lower panel, middle, ellipses with positions and areas corresponding to the relevant data of spots in SDD and with grey-scale colour coding of the magnetic polarities corresponding to that of the magnetograms), SOHO/MDI continuum images (lower panel, left) and magnetograms (lower panel, right), SOHO/EIT images (upper panel, middle), GOES and RHESSI flare data (red and blue symbols) observed within the interval around the time of SDD data. |
|
When you want to zoom in on one of the images, simply move the mouse pointer over that image. |
 |
| Year | Month | Day | Hour | Min | Sec | NOAA | Proj.U | Proj.WS | Corr.U | Corr.WS | B | L | LCM | Pos.angle | r | MU | MP |
|---|---|---|---|---|---|---|---|---|---|---|---|---|---|---|---|---|---|
| 2003 | 05 | 30 | 15 | 59 | 32 | 10365 | 178 | 1427 | 155 | 1256 | -6.99 | 183.94 | 55.56 | 262.08 | 0.8282 | -159.7 | 82.2 |
| Flare | Date | Start | Peak | End | Dur [s] | Peak [c/s] | Total Counts | Energy [keV] | X pos [asec] | Y pos [asec] | Radial [asec] | B [deg] | L [deg] | Flags |
|---|---|---|---|---|---|---|---|---|---|---|---|---|---|---|
| 3053075 | 30-May-2003 | 15:21:24 | 15:24:38 | 15:24:52 | 208 | 48 | 18912 | 6-12 | 788 | -117 | 796 | -7.55 | 183.31 | A0 DF GE P1 PE |
| 30530102 | 30-May-2003 | 15:43:20 | 15:43:42 | 15:46:40 | 200 | 11 | 10032 | 6-12 | 840 | -108 | 847 | -6.93 | 189.07 | A0 DF GS P1 |
| 30530131 | 30-May-2003 | 15:46:40 | 15:48:10 | 15:51:24 | 284 | 11 | 13128 | 6-12 | 827 | -95 | 832 | -6.17 | 187.26 | A0 DF P1 |
| 30530132 | 30-May-2003 | 15:51:24 | 15:56:02 | 15:57:48 | 384 | 20 | 19608 | 6-12 | 794 | -106 | 802 | -6.88 | 183.55 | A0 DF P1 |
| 30530103 | 30-May-2003 | 15:57:48 | 16:00:06 | 16:10:52 | 784 | 18 | 42480 | 6-12 | 773 | -116 | 782 | -7.51 | 181.40 | A0 DF P1 |
| 30530133 | 30-May-2003 | 16:57:24 | 17:07:06 | 17:15:24 | 1080 | 2 | 5465 | 6-12 | 836 | -150 | 849 | -9.45 | 188.47 | A0 DF P1 PE |
| Date | Start | Peak | End | Classification | B [deg] | LCM [deg] |
|---|---|---|---|---|---|---|
| No data |

