move the mouse pointer over that image.
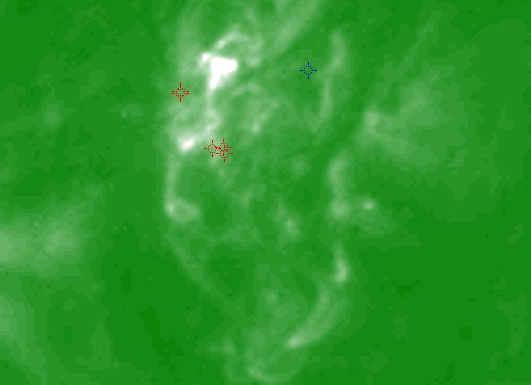
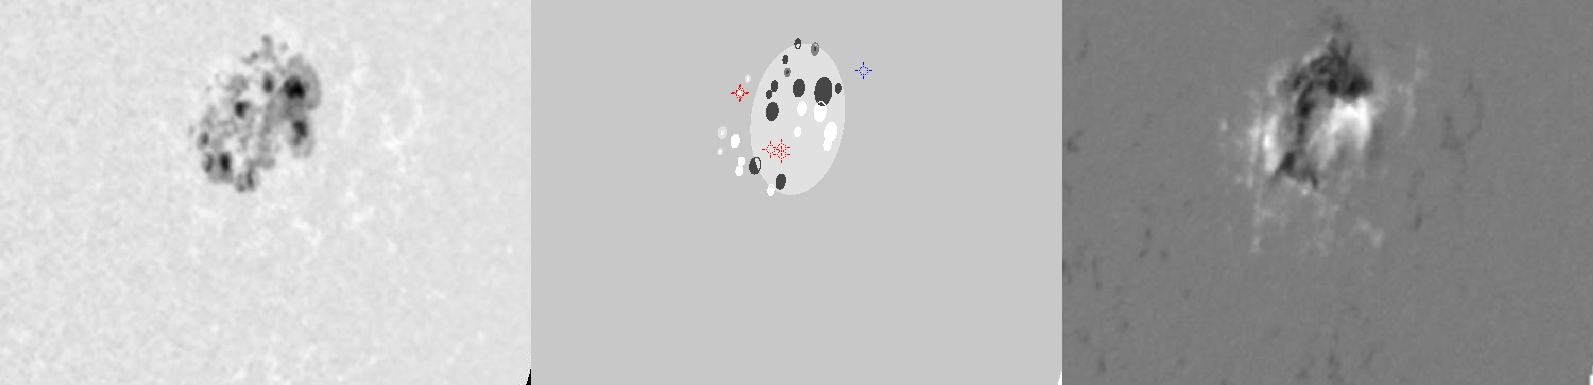
| Evolution of sunspot group NOAA 10365 and positions of flares in it animated by using the data of SOHO/MDI Debrecen Data (SDD) sunspot catalogue (lower panel, middle, ellipses with positions and areas corresponding to the relevant data of spots in SDD and with grey-scale colour coding of the magnetic polarities corresponding to that of the magnetograms), SOHO/MDI continuum images (lower panel, left) and magnetograms (lower panel, right), SOHO/EIT images (upper panel, middle), GOES and RHESSI flare data (red and blue symbols) observed within the interval around the time of SDD data. |
|
When you want to zoom in on one of the images, simply move the mouse pointer over that image. |
 |
| Year | Month | Day | Hour | Min | Sec | NOAA | Proj.U | Proj.WS | Corr.U | Corr.WS | B | L | LCM | Pos.angle | r | MU | MP |
|---|---|---|---|---|---|---|---|---|---|---|---|---|---|---|---|---|---|
| 2003 | 05 | 30 | 10 | 00 | 32 | 10365 | 259 | 1518 | 213 | 1240 | -6.71 | 184.17 | 52.48 | 262.21 | 0.7971 | 19.7 | 87.3 |
| Flare | Date | Start | Peak | End | Dur [s] | Peak [c/s] | Total Counts | Energy [keV] | X pos [asec] | Y pos [asec] | Radial [asec] | B [deg] | L [deg] | Flags |
|---|---|---|---|---|---|---|---|---|---|---|---|---|---|---|
| 30530126 | 30-May-2003 | 07:27:32 | 07:28:06 | 07:28:20 | 48 | 36 | 8976 | 6-12 | 706 | -87 | 712 | -5.89 | 179.47 | A0 DF DR P1 PE |
| 3053069 | 30-May-2003 | 07:28:40 | 07:29:38 | 07:31:04 | 144 | 112 | 58560 | 6-12 | 706 | -88 | 712 | -5.95 | 179.46 | A0 DF DR P1 |
| 3053093 | 30-May-2003 | 07:37:08 | 07:38:34 | 07:41:04 | 236 | 72 | 43056 | 6-12 | 735 | -122 | 745 | -7.95 | 182.33 | A0 DF P1 |
| 3053094 | 30-May-2003 | 07:42:44 | 07:43:46 | 07:46:20 | 216 | 36 | 23784 | 6-12 | 736 | -126 | 747 | -8.19 | 182.42 | A0 DF P1 |
| 3053095 | 30-May-2003 | 08:03:40 | 08:05:46 | 08:06:28 | 168 | 14 | 9408 | 6-12 | 733 | -123 | 744 | -8.01 | 181.90 | A0 DF P1 |
| Date | Start | Peak | End | Classification | B [deg] | LCM [deg] |
|---|---|---|---|---|---|---|
| 30-May-2003 | 06:39 | 06:50 | 06:56 | C8.6 | -05 | 55 |

