move the mouse pointer over that image.
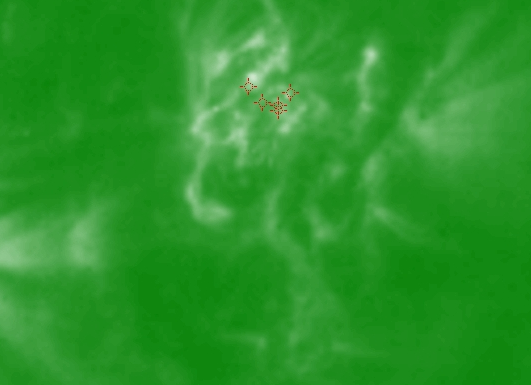
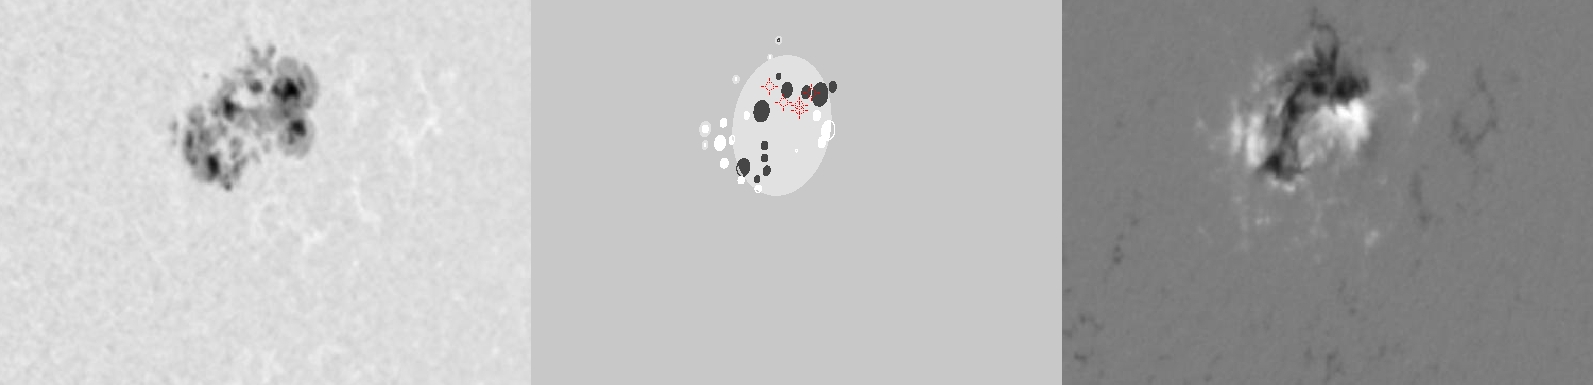
| Evolution of sunspot group NOAA 10365 and positions of flares in it animated by using the data of SOHO/MDI Debrecen Data (SDD) sunspot catalogue (lower panel, middle, ellipses with positions and areas corresponding to the relevant data of spots in SDD and with grey-scale colour coding of the magnetic polarities corresponding to that of the magnetograms), SOHO/MDI continuum images (lower panel, left) and magnetograms (lower panel, right), SOHO/EIT images (upper panel, middle), GOES and RHESSI flare data (red and blue symbols) observed within the interval around the time of SDD data. |
|
When you want to zoom in on one of the images, simply move the mouse pointer over that image. |
 |
| Year | Month | Day | Hour | Min | Sec | NOAA | Proj.U | Proj.WS | Corr.U | Corr.WS | B | L | LCM | Pos.angle | r | MU | MP |
|---|---|---|---|---|---|---|---|---|---|---|---|---|---|---|---|---|---|
| 2003 | 05 | 29 | 23 | 59 | 32 | 10365 | 258 | 1498 | 185 | 1084 | -6.95 | 183.74 | 46.53 | 261.29 | 0.7309 | -106.3 | 74.9 |
| Flare | Date | Start | Peak | End | Dur [s] | Peak [c/s] | Total Counts | Energy [keV] | X pos [asec] | Y pos [asec] | Radial [asec] | B [deg] | L [deg] | Flags |
|---|---|---|---|---|---|---|---|---|---|---|---|---|---|---|
| 3052996 | 29-May-2003 | 23:12:04 | 23:17:22 | 23:26:40 | 876 | 35 | 98150 | 6-12 | 701 | -92 | 707 | -6.22 | 183.57 | A0 DF DR P1 PE |
| 3052997 | 29-May-2003 | 23:34:28 | 23:35:18 | 23:37:00 | 152 | 29 | 17741 | 6-12 | 696 | -82 | 701 | -5.63 | 182.90 | A0 DF P1 |
| 30529116 | 29-May-2003 | 23:39:32 | 23:39:46 | 23:41:04 | 92 | 13 | 5414 | 6-12 | 723 | -86 | 728 | -5.84 | 185.30 | A0 DF P1 |
| 3052999 | 29-May-2003 | 23:47:52 | 23:48:30 | 23:50:16 | 144 | 19 | 10752 | 6-12 | 717 | -94 | 723 | -6.32 | 184.73 | A0 DF DR P1 PE |
| 3053082 | 30-May-2003 | 00:01:28 | 00:02:34 | 00:05:44 | 256 | 18 | 18079 | 6-12 | 720 | -97 | 726 | -6.50 | 184.90 | A0 DF DR P1 PE |
| Date | Start | Peak | End | Classification | B [deg] | LCM [deg] |
|---|---|---|---|---|---|---|
| No data |

