move the mouse pointer over that image.
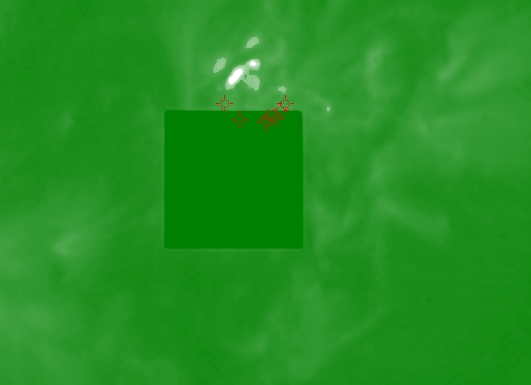
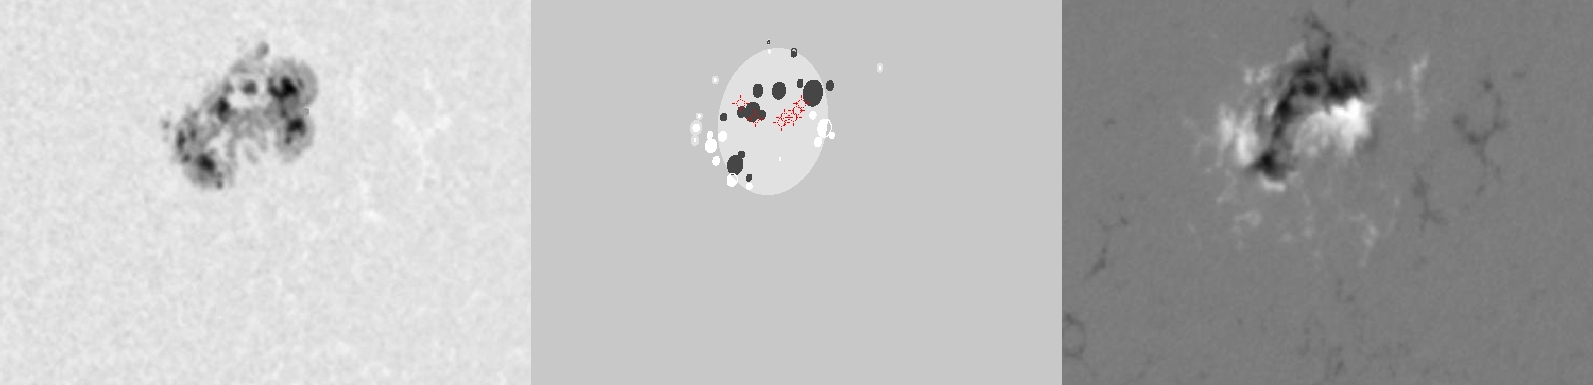
| Evolution of sunspot group NOAA 10365 and positions of flares in it animated by using the data of SOHO/MDI Debrecen Data (SDD) sunspot catalogue (lower panel, middle, ellipses with positions and areas corresponding to the relevant data of spots in SDD and with grey-scale colour coding of the magnetic polarities corresponding to that of the magnetograms), SOHO/MDI continuum images (lower panel, left) and magnetograms (lower panel, right), SOHO/EIT images (upper panel, middle), GOES and RHESSI flare data (red and blue symbols) observed within the interval around the time of SDD data. |
|
When you want to zoom in on one of the images, simply move the mouse pointer over that image. |
 |
| Year | Month | Day | Hour | Min | Sec | NOAA | Proj.U | Proj.WS | Corr.U | Corr.WS | B | L | LCM | Pos.angle | r | MU | MP |
|---|---|---|---|---|---|---|---|---|---|---|---|---|---|---|---|---|---|
| 2003 | 05 | 29 | 17 | 35 | 32 | 10365 | 293 | 1752 | 196 | 1188 | -6.84 | 183.50 | 42.76 | 260.94 | 0.6848 | -306.5 | 78.9 |
| Flare | Date | Start | Peak | End | Dur [s] | Peak [c/s] | Total Counts | Energy [keV] | X pos [asec] | Y pos [asec] | Radial [asec] | B [deg] | L [deg] | Flags |
|---|---|---|---|---|---|---|---|---|---|---|---|---|---|---|
| 3052990 | 29-May-2003 | 16:51:56 | 16:55:10 | 16:59:48 | 472 | 20 | 46416 | 6-12 | 674 | -92 | 680 | -6.28 | 184.76 | A0 DF P1 PE |
| 3052953 | 29-May-2003 | 17:15:56 | 17:25:18 | 17:38:12 | 1336 | 288 | 803856 | 12-25 | 643 | -92 | 649 | -6.31 | 181.91 | A0 DF DR P1 |
| 3052954 | 29-May-2003 | 18:23:12 | 18:24:50 | 18:29:40 | 388 | 48 | 83520 | 6-12 | 665 | -102 | 673 | -6.88 | 183.24 | A0 DF DR P1 |
| 30529112 | 29-May-2003 | 18:29:40 | 18:34:06 | 18:43:04 | 804 | 76 | 221712 | 6-12 | 683 | -104 | 691 | -6.98 | 184.70 | A0 DF DR P1 PE |
| 30529113 | 29-May-2003 | 18:43:04 | 18:44:34 | 18:47:08 | 244 | 34 | 40416 | 6-12 | 687 | -101 | 695 | -6.79 | 184.92 | A0 DF P1 |
| 3052991 | 29-May-2003 | 18:47:08 | 18:49:42 | 18:52:48 | 340 | 34 | 50208 | 6-12 | 693 | -101 | 701 | -6.79 | 185.40 | A0 DF P1 |
| 3052992 | 29-May-2003 | 18:57:28 | 19:03:26 | 19:21:32 | 1444 | 184 | 557904 | 6-12 | 698 | -97 | 705 | -6.54 | 185.68 | A0 DF DR P1 |
| Date | Start | Peak | End | Classification | B [deg] | LCM [deg] |
|---|---|---|---|---|---|---|
| No data |

