move the mouse pointer over that image.
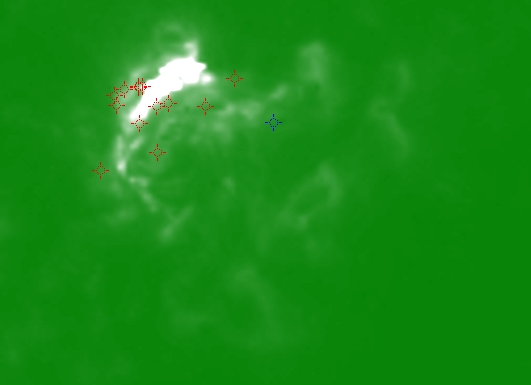
| Evolution of sunspot group NOAA 10365 and positions of flares in it animated by using the data of SOHO/MDI Debrecen Data (SDD) sunspot catalogue (lower panel, middle, ellipses with positions and areas corresponding to the relevant data of spots in SDD and with grey-scale colour coding of the magnetic polarities corresponding to that of the magnetograms), SOHO/MDI continuum images (lower panel, left) and magnetograms (lower panel, right), SOHO/EIT images (upper panel, middle), GOES and RHESSI flare data (red and blue symbols) observed within the interval around the time of SDD data. |
|
When you want to zoom in on one of the images, simply move the mouse pointer over that image. |
 |
| Year | Month | Day | Hour | Min | Sec | NOAA | Proj.U | Proj.WS | Corr.U | Corr.WS | B | L | LCM | Pos.angle | r | MU | MP |
|---|---|---|---|---|---|---|---|---|---|---|---|---|---|---|---|---|---|
| 2003 | 05 | 28 | 22 | 23 | 32 | 10365 | 366 | 2006 | 215 | 1181 | -6.90 | 183.48 | 32.15 | 258.72 | 0.5408 | -259.7 | 21.0 |
| Flare | Date | Start | Peak | End | Dur [s] | Peak [c/s] | Total Counts | Energy [keV] | X pos [asec] | Y pos [asec] | Radial [asec] | B [deg] | L [deg] | Flags |
|---|---|---|---|---|---|---|---|---|---|---|---|---|---|---|
| 30528119 | 28-May-2003 | 21:53:56 | 21:59:34 | 22:01:20 | 444 | 40 | 36168 | 6-12 | 550 | -73 | 555 | -5.34 | 185.40 | A0 DF P1 |
| 30528120 | 28-May-2003 | 22:01:20 | 22:05:26 | 22:13:04 | 704 | 1200 | 836520 | 12-25 | 493 | -78 | 499 | -5.68 | 181.30 | A0 DF P1 |
| 3052847 | 28-May-2003 | 22:13:48 | 22:16:34 | 22:19:44 | 356 | 176 | 77064 | 12-25 | 487 | -80 | 494 | -5.80 | 180.78 | A0 DF DR P1 PE |
| 30528152 | 28-May-2003 | 22:19:44 | 22:20:10 | 22:21:52 | 128 | 26 | 12336 | 6-12 | 499 | -78 | 505 | -5.68 | 181.58 | A0 DF DR P1 |
| 30528121 | 28-May-2003 | 22:21:52 | 22:23:30 | 22:27:12 | 320 | 46 | 26424 | 6-12 | 484 | -90 | 493 | -6.40 | 180.55 | A0 DF DR P1 |
| 30528122 | 28-May-2003 | 22:31:16 | 22:32:10 | 22:32:44 | 88 | 112 | 16008 | 6-12 | 485 | -84 | 493 | -6.04 | 180.51 | A0 DF DR P1 |
| 30528153 | 28-May-2003 | 23:10:20 | 23:16:42 | 23:25:56 | 936 | 420 | 299981 | 6-12 | 529 | -89 | 536 | -6.31 | 183.23 | A0 DF DR P1 PE |
| 30528123 | 28-May-2003 | 23:25:56 | 23:27:50 | 23:30:20 | 264 | 38 | 28274 | 6-12 | 491 | -131 | 508 | -8.85 | 180.64 | A0 DF DR P1 |
| 30528124 | 28-May-2003 | 23:30:20 | 23:35:02 | 23:36:56 | 396 | 29 | 32609 | 6-12 | 556 | -91 | 563 | -6.40 | 185.04 | A0 DF P1 |
| 30528125 | 28-May-2003 | 23:36:56 | 23:38:30 | 23:41:48 | 292 | 29 | 28879 | 6-12 | 528 | -120 | 541 | -8.16 | 183.12 | A0 DF P1 |
| 30528126 | 28-May-2003 | 23:41:48 | 23:43:46 | 23:47:32 | 344 | 806 | 287482 | 12-25 | 529 | -91 | 537 | -6.42 | 182.99 | A0 DF P1 |
| 3052844 | 28-May-2003 | 23:47:32 | 23:48:38 | 23:49:20 | 108 | 21 | 10231 | 6-12 | 520 | -102 | 530 | -7.09 | 182.36 | A0 DF DR P1 |
| 3052960 | 29-May-2003 | 00:00:08 | 00:01:42 | 00:04:48 | 280 | 46 | 25575 | 6-12 | 523 | -79 | 529 | -5.71 | 182.35 | A0 DF DR P1 PE |
| Date | Start | Peak | End | Classification | B [deg] | LCM [deg] |
|---|---|---|---|---|---|---|
| 28-May-2003 | 22:02 | 22:06 | 22:08 | C1.6 | -07 | 36 |

