move the mouse pointer over that image.
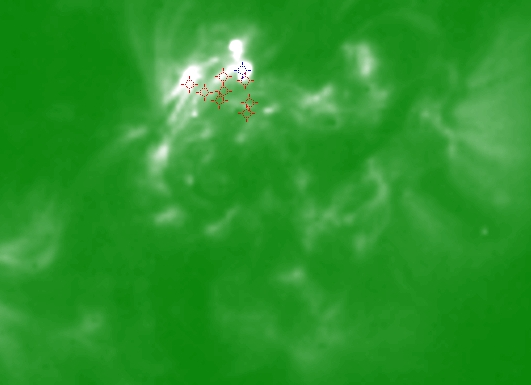
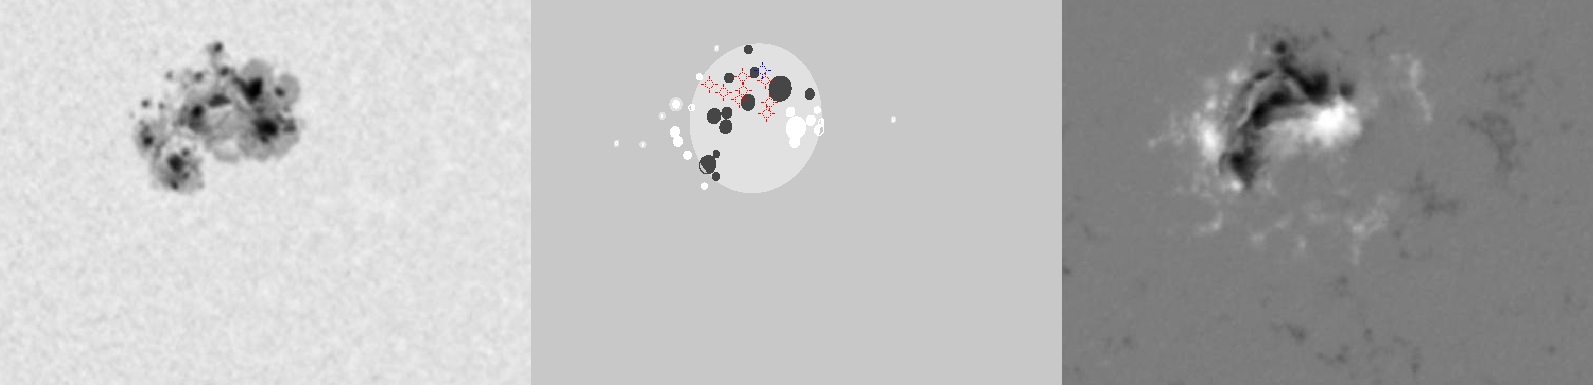
| Evolution of sunspot group NOAA 10365 and positions of flares in it animated by using the data of SOHO/MDI Debrecen Data (SDD) sunspot catalogue (lower panel, middle, ellipses with positions and areas corresponding to the relevant data of spots in SDD and with grey-scale colour coding of the magnetic polarities corresponding to that of the magnetograms), SOHO/MDI continuum images (lower panel, left) and magnetograms (lower panel, right), SOHO/EIT images (upper panel, middle), GOES and RHESSI flare data (red and blue symbols) observed within the interval around the time of SDD data. |
|
When you want to zoom in on one of the images, simply move the mouse pointer over that image. |
 |
| Year | Month | Day | Hour | Min | Sec | NOAA | Proj.U | Proj.WS | Corr.U | Corr.WS | B | L | LCM | Pos.angle | r | MU | MP |
|---|---|---|---|---|---|---|---|---|---|---|---|---|---|---|---|---|---|
| 2003 | 05 | 28 | 18 | 05 | 32 | 10365 | 345 | 2103 | 199 | 1208 | -6.69 | 183.61 | 29.92 | 258.48 | 0.5075 | -224.5 | 15.1 |
| Flare | Date | Start | Peak | End | Dur [s] | Peak [c/s] | Total Counts | Energy [keV] | X pos [asec] | Y pos [asec] | Radial [asec] | B [deg] | L [deg] | Flags |
|---|---|---|---|---|---|---|---|---|---|---|---|---|---|---|
| 3052826 | 28-May-2003 | 15:41:28 | 15:45:30 | 16:00:36 | 1148 | 76 | 76307 | 12-25 | 451 | -70 | 456 | -5.26 | 181.87 | a0 A1 DF GS P1 |
| 30528142 | 28-May-2003 | 16:00:36 | 16:03:38 | 16:07:56 | 440 | 1 | 965 | 6-12 | 456 | -79 | 463 | -5.79 | 182.08 | A0 DF P1 |
| 30528114 | 28-May-2003 | 17:16:00 | 17:16:10 | 17:19:16 | 196 | 1 | 539 | 6-12 | 463 | -80 | 470 | -5.84 | 181.89 | A0 DF GS P1 |
| 30528143 | 28-May-2003 | 17:19:16 | 17:21:18 | 17:25:00 | 344 | 5 | 3347 | 12-25 | 474 | -85 | 482 | -6.13 | 182.62 | A0 DF DR P1 |
| 3052891 | 28-May-2003 | 17:25:00 | 17:34:22 | 17:44:40 | 1180 | 56 | 90375 | 12-25 | 459 | -75 | 465 | -5.55 | 181.43 | a0 A1 DF DR EE P1 |
| 3052892 | 28-May-2003 | 18:17:04 | 18:18:26 | 18:23:20 | 376 | 81 | 82641 | 6-12 | 505 | -73 | 510 | -5.39 | 184.21 | A0 a1 DF DR P1 PE |
| 30528144 | 28-May-2003 | 18:23:20 | 18:26:06 | 18:29:24 | 364 | 29 | 38155 | 6-12 | 508 | -94 | 517 | -6.64 | 184.43 | A0 DF DR P1 PE |
| 30528145 | 28-May-2003 | 18:30:16 | 18:30:34 | 18:31:04 | 48 | 9 | 2280 | 6-12 | 511 | -87 | 518 | -6.22 | 184.57 | A0 DF P1 PE |
| Date | Start | Peak | End | Classification | B [deg] | LCM [deg] |
|---|---|---|---|---|---|---|
| 28-May-2003 | 15:22 | 15:31 | 15:35 | C1.5 | -01 | 27 |
| 28-May-2003 | 15:37 | 15:46 | 15:51 | C3.5 | -05 | 29 |
| 28-May-2003 | 17:31 | 17:46 | 17:52 | C3.5 | 00 | 28 |

