move the mouse pointer over that image.
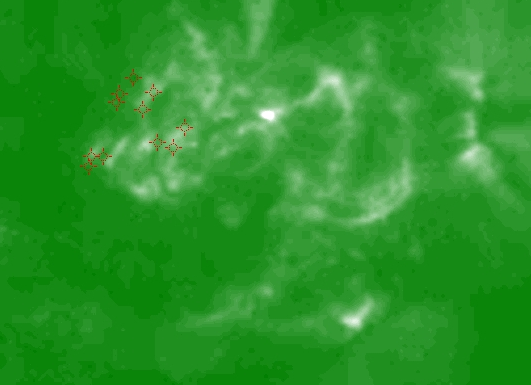
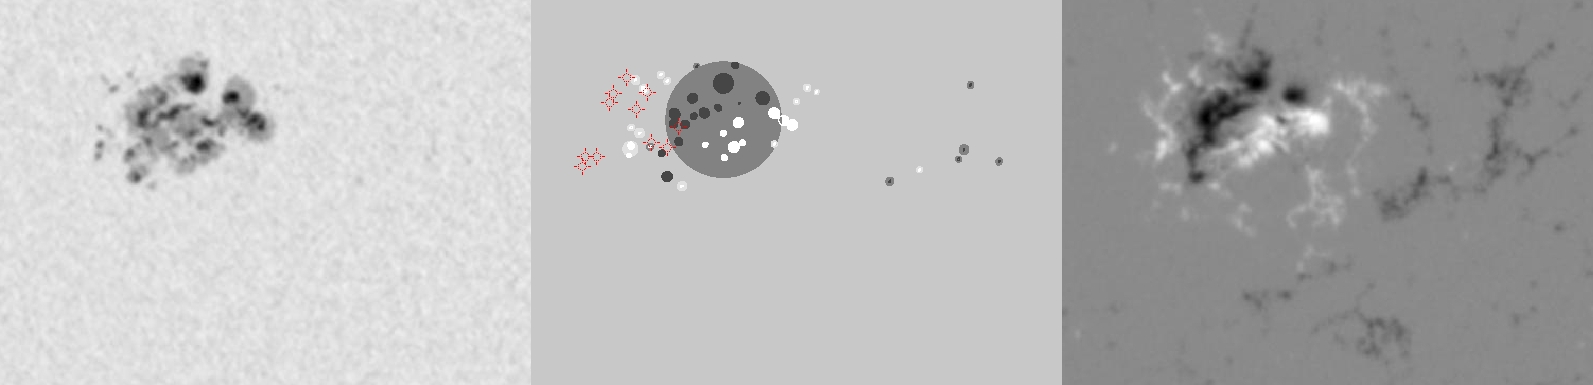
| Evolution of sunspot group NOAA 10365 and positions of flares in it animated by using the data of SOHO/MDI Debrecen Data (SDD) sunspot catalogue (lower panel, middle, ellipses with positions and areas corresponding to the relevant data of spots in SDD and with grey-scale colour coding of the magnetic polarities corresponding to that of the magnetograms), SOHO/MDI continuum images (lower panel, left) and magnetograms (lower panel, right), SOHO/EIT images (upper panel, middle), GOES and RHESSI flare data (red and blue symbols) observed within the interval around the time of SDD data. |
|
When you want to zoom in on one of the images, simply move the mouse pointer over that image. |
 |
| Year | Month | Day | Hour | Min | Sec | NOAA | Proj.U | Proj.WS | Corr.U | Corr.WS | B | L | LCM | Pos.angle | r | MU | MP |
|---|---|---|---|---|---|---|---|---|---|---|---|---|---|---|---|---|---|
| 2003 | 05 | 26 | 22 | 23 | 32 | 10365 | 235 | 1562 | 116 | 785 | -6.77 | 183.68 | 5.89 | 225.83 | 0.1429 | -505.4 | -68.2 |
| Flare | Date | Start | Peak | End | Dur [s] | Peak [c/s] | Total Counts | Energy [keV] | X pos [asec] | Y pos [asec] | Radial [asec] | B [deg] | L [deg] | Flags |
|---|---|---|---|---|---|---|---|---|---|---|---|---|---|---|
| 3052682 | 26-May-2003 | 21:37:56 | 21:41:38 | 21:53:12 | 916 | 128 | 325488 | 12-25 | 69 | -109 | 129 | -7.94 | 181.15 | A0 DF DR P1 PE |
| 3052698 | 26-May-2003 | 21:53:12 | 21:55:02 | 22:00:08 | 416 | 60 | 92640 | 6-12 | 80 | -96 | 125 | -7.16 | 181.69 | A0 DF P1 |
| 3052683 | 26-May-2003 | 22:00:08 | 22:03:14 | 22:07:16 | 428 | 92 | 133920 | 6-12 | 63 | -74 | 97 | -5.85 | 180.58 | A0 DF P1 |
| 3052684 | 26-May-2003 | 22:07:16 | 22:08:46 | 22:09:56 | 160 | 80 | 50688 | 6-12 | 52 | -65 | 83 | -5.31 | 179.87 | A0 DF P1 |
| 3052699 | 26-May-2003 | 22:09:56 | 22:11:14 | 22:15:24 | 328 | 100 | 91632 | 6-12 | 44 | -75 | 87 | -5.91 | 179.37 | A0 DF DR P1 |
| 30526100 | 26-May-2003 | 22:15:24 | 22:17:38 | 22:19:08 | 224 | 44 | 43392 | 6-12 | 44 | -81 | 93 | -6.26 | 179.31 | A0 DF DR P1 |
| 3052620 | 26-May-2003 | 23:00:24 | 23:09:26 | 23:34:24 | 2040 | 192 | 1564560 | 6-12 | 44 | -115 | 123 | -8.29 | 178.85 | A0 DF DR P1 PE |
| 30526101 | 26-May-2003 | 23:34:24 | 23:35:42 | 23:37:32 | 188 | 72 | 66336 | 6-12 | 50 | -121 | 131 | -8.65 | 178.97 | A0 DF P1 |
| 3052687 | 26-May-2003 | 23:37:32 | 23:41:18 | 23:42:48 | 316 | 120 | 122688 | 6-12 | 61 | -115 | 130 | -8.29 | 179.58 | A0 DF P1 |
| 30526102 | 26-May-2003 | 23:42:48 | 23:47:02 | 23:50:08 | 440 | 192 | 183408 | 6-12 | 97 | -106 | 144 | -7.75 | 181.69 | A0 DF DR P1 |
| 3052688 | 26-May-2003 | 23:54:24 | 23:58:06 | 23:59:16 | 292 | 84 | 94512 | 6-12 | 91 | -85 | 125 | -6.49 | 181.21 | A0 DF DR P1 PE |
| Date | Start | Peak | End | Classification | B [deg] | LCM [deg] |
|---|---|---|---|---|---|---|
| No data |

