move the mouse pointer over that image.
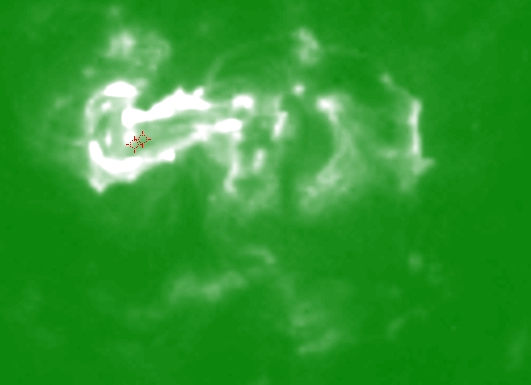
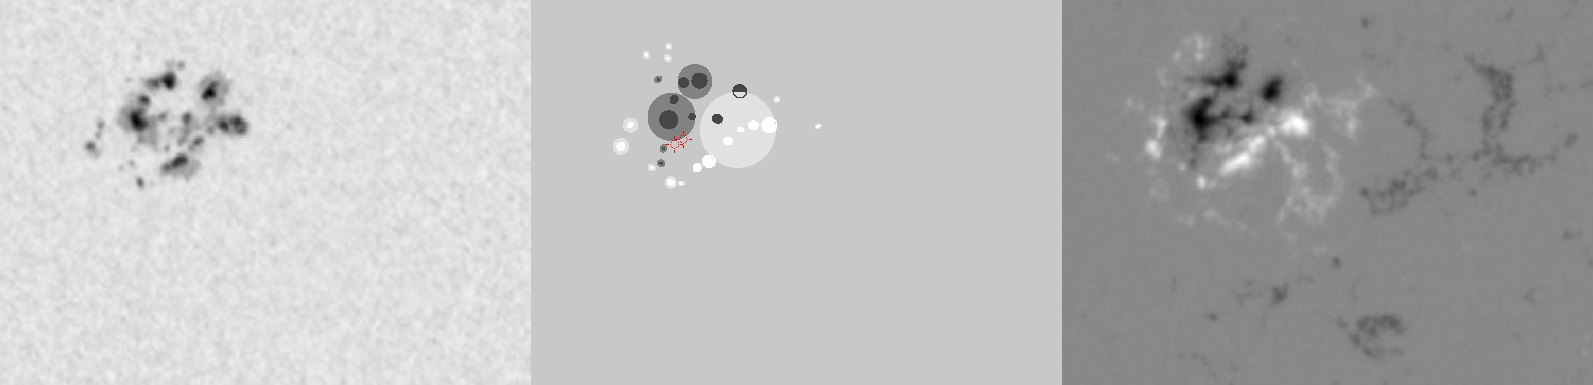
| Evolution of sunspot group NOAA 10365 and positions of flares in it animated by using the data of SOHO/MDI Debrecen Data (SDD) sunspot catalogue (lower panel, middle, ellipses with positions and areas corresponding to the relevant data of spots in SDD and with grey-scale colour coding of the magnetic polarities corresponding to that of the magnetograms), SOHO/MDI continuum images (lower panel, left) and magnetograms (lower panel, right), SOHO/EIT images (upper panel, middle), GOES and RHESSI flare data (red and blue symbols) observed within the interval around the time of SDD data. |
|
When you want to zoom in on one of the images, simply move the mouse pointer over that image. |
 |
| Year | Month | Day | Hour | Min | Sec | NOAA | Proj.U | Proj.WS | Corr.U | Corr.WS | B | L | LCM | Pos.angle | r | MU | MP |
|---|---|---|---|---|---|---|---|---|---|---|---|---|---|---|---|---|---|
| 2003 | 05 | 26 | 07 | 59 | 32 | 10365 | 189 | 1055 | 96 | 528 | -6.87 | 183.40 | -2.33 | 157.77 | 0.1076 | -289.9 | -69.2 |
| Flare | Date | Start | Peak | End | Dur [s] | Peak [c/s] | Total Counts | Energy [keV] | X pos [asec] | Y pos [asec] | Radial [asec] | B [deg] | L [deg] | Flags |
|---|---|---|---|---|---|---|---|---|---|---|---|---|---|---|
| 3052606 | 26-May-2003 | 07:19:20 | 07:20:02 | 07:44:32 | 1512 | 4336 | 21260544 | 12-25 | -48 | -102 | 113 | -7.59 | 182.04 | A0 DR GS P1 |
| 3052663 | 26-May-2003 | 07:44:32 | 07:45:30 | 08:03:44 | 1152 | 1648 | 7444440 | 6-12 | -46 | -105 | 114 | -7.77 | 181.93 | A0 DR P1 |
| Date | Start | Peak | End | Classification | B [deg] | LCM [deg] |
|---|---|---|---|---|---|---|
| No data |

