
move the mouse pointer over that image.
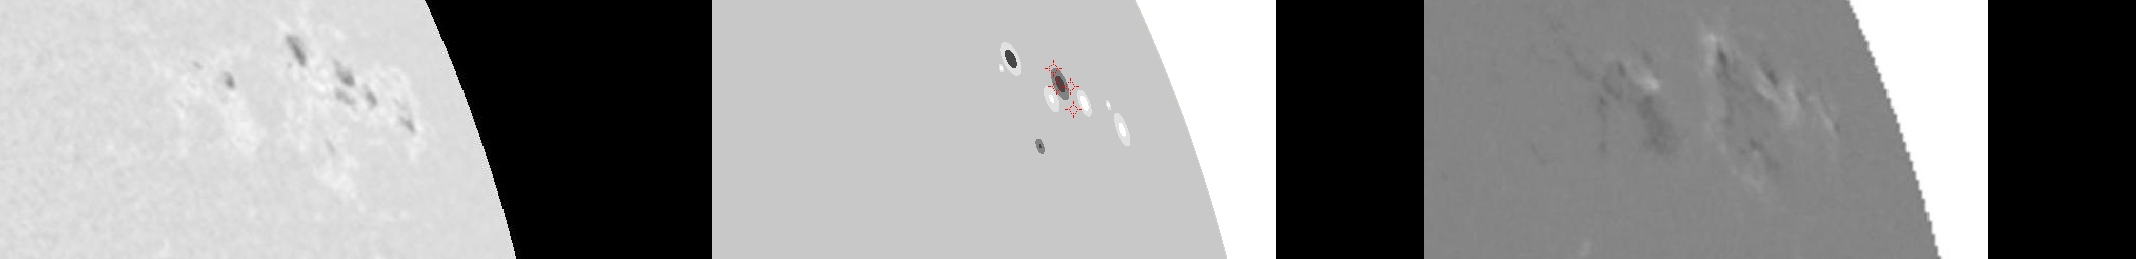
| Evolution of sunspot group NOAA 10338 and positions of flares in it animated by using the data of SOHO/MDI Debrecen Data (SDD) sunspot catalogue (lower panel, middle, ellipses with positions and areas corresponding to the relevant data of spots in SDD and with grey-scale colour coding of the magnetic polarities corresponding to that of the magnetograms), SOHO/MDI continuum images (lower panel, left) and magnetograms (lower panel, right), SOHO/EIT images (upper panel, middle), GOES and RHESSI flare data (red and blue symbols) observed within the interval around the time of SDD data. |
|
When you want to zoom in on one of the images, simply move the mouse pointer over that image. |
 |
| Year | Month | Day | Hour | Min | Sec | NOAA | Proj.U | Proj.WS | Corr.U | Corr.WS | B | L | LCM | Pos.angle | r | MU | MP |
|---|---|---|---|---|---|---|---|---|---|---|---|---|---|---|---|---|---|
| 2003 | 04 | 26 | 11 | 11 | 33 | 10338 | 42 | 212 | 58 | 291 | 19.02 | 286.30 | 65.73 | 292.53 | 0.9331 | -55.7 | 153.7 |
| Flare | Date | Start | Peak | End | Dur [s] | Peak [c/s] | Total Counts | Energy [keV] | X pos [asec] | Y pos [asec] | Radial [asec] | B [deg] | L [deg] | Flags |
|---|---|---|---|---|---|---|---|---|---|---|---|---|---|---|
| 3042691 | 26-Apr-2003 | 10:55:32 | 10:57:10 | 11:02:20 | 408 | 13 | 20544 | 6-12 | 837 | 332 | 901 | 18.40 | 286.28 | A0 DF P1 |
| 3042692 | 26-Apr-2003 | 11:05:40 | 11:07:50 | 11:14:16 | 516 | 28 | 46344 | 6-12 | 828 | 346 | 898 | 19.24 | 285.41 | A0 DF P1 |
| 30426122 | 26-Apr-2003 | 11:16:36 | 11:18:18 | 11:20:20 | 224 | 26 | 19848 | 6-12 | 827 | 357 | 901 | 19.98 | 285.77 | A0 DF P1 |
| 30426123 | 26-Apr-2003 | 11:20:20 | 11:27:14 | 11:31:04 | 644 | 160 | 167208 | 6-12 | 838 | 346 | 907 | 19.37 | 286.97 | A0 DF DR P1 |
| Date | Start | Peak | End | Classification | B [deg] | LCM [deg] |
|---|---|---|---|---|---|---|
| No data |

