
move the mouse pointer over that image.
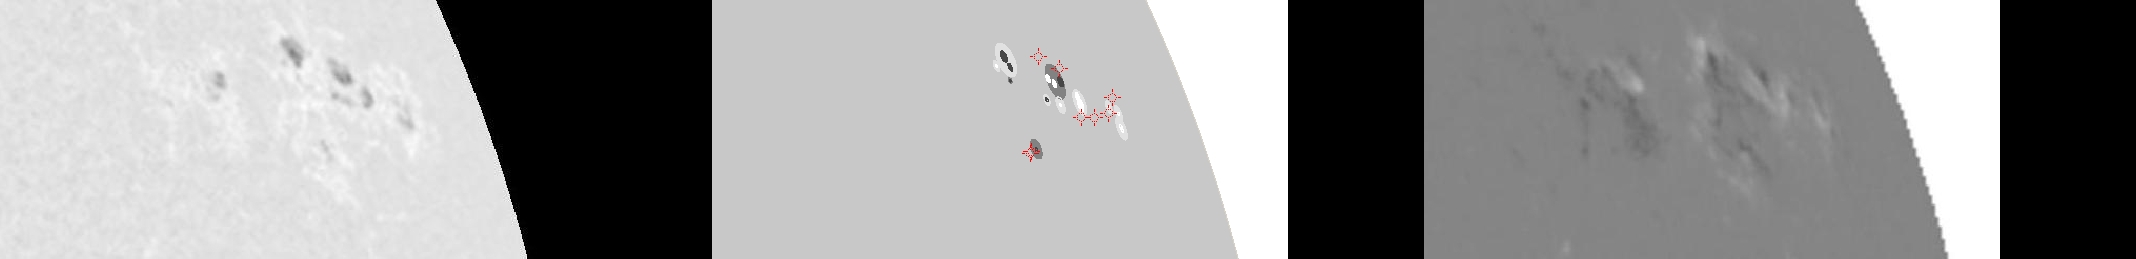
| Evolution of sunspot group NOAA 10338 and positions of flares in it animated by using the data of SOHO/MDI Debrecen Data (SDD) sunspot catalogue (lower panel, middle, ellipses with positions and areas corresponding to the relevant data of spots in SDD and with grey-scale colour coding of the magnetic polarities corresponding to that of the magnetograms), SOHO/MDI continuum images (lower panel, left) and magnetograms (lower panel, right), SOHO/EIT images (upper panel, middle), GOES and RHESSI flare data (red and blue symbols) observed within the interval around the time of SDD data. |
|
When you want to zoom in on one of the images, simply move the mouse pointer over that image. |
 |
| Year | Month | Day | Hour | Min | Sec | NOAA | Proj.U | Proj.WS | Corr.U | Corr.WS | B | L | LCM | Pos.angle | r | MU | MP |
|---|---|---|---|---|---|---|---|---|---|---|---|---|---|---|---|---|---|
| 2003 | 04 | 26 | 08 | 38 | 33 | 10338 | 34 | 235 | 45 | 298 | 19.09 | 285.88 | 63.91 | 293.03 | 0.9224 | 72.9 | 143.0 |
| Flare | Date | Start | Peak | End | Dur [s] | Peak [c/s] | Total Counts | Energy [keV] | X pos [asec] | Y pos [asec] | Radial [asec] | B [deg] | L [deg] | Flags |
|---|---|---|---|---|---|---|---|---|---|---|---|---|---|---|
| 3042678 | 26-Apr-2003 | 07:21:20 | 07:21:26 | 07:25:32 | 252 | 0 | 305 | 6-12 | 796 | 309 | 854 | 16.40 | 281.28 | A0 DF GS P1 |
| 30426120 | 26-Apr-2003 | 07:25:32 | 07:26:50 | 07:29:36 | 244 | 0 | 250 | 6-12 | 796 | 308 | 854 | 16.34 | 281.19 | A0 DF P1 |
| 3042679 | 26-Apr-2003 | 07:35:32 | 07:37:06 | 07:39:52 | 260 | 0 | 290 | 6-12 | 829 | 330 | 892 | 18.16 | 286.69 | A0 DF P1 |
| 3042680 | 26-Apr-2003 | 07:39:52 | 07:43:26 | 07:47:08 | 436 | 1 | 1153 | 6-12 | 803 | 368 | 884 | 20.43 | 284.49 | A0 DF P1 |
| 3042681 | 26-Apr-2003 | 07:47:08 | 07:58:30 | 08:01:12 | 844 | 24 | 22093 | 25-50 | 850 | 342 | 916 | 19.27 | 290.90 | A0 DF P1 |
| 3042610 | 26-Apr-2003 | 08:01:12 | 08:06:54 | 08:13:00 | 708 | 2122 | 1591020 | 100-300 | 849 | 332 | 911 | 18.57 | 290.00 | a0 a1 A3 DF P1 |
| 3042650 | 26-Apr-2003 | 08:13:00 | 08:13:30 | 08:18:24 | 324 | 10 | 7845 | 12-25 | 841 | 329 | 904 | 18.25 | 288.31 | a0 A1 DF P1 |
| 3042684 | 26-Apr-2003 | 08:54:08 | 08:59:34 | 09:04:32 | 624 | 22 | 30144 | 6-12 | 825 | 359 | 900 | 20.09 | 286.81 | A0 DF DR P1 |
| Date | Start | Peak | End | Classification | B [deg] | LCM [deg] |
|---|---|---|---|---|---|---|
| No data |

